User Guide
This is a task-oriented walkthrough of tripl, written for product managers and analysts. It follows the same four-step shape the product is built around — Plan → Observe → Govern → Connect — and takes you from an empty screen to a working, tuned alert.
It assumes the app is already running and reachable in your browser — if it isn't yet, the Quick Start gets you from zero to a running instance and a first working alert. If a term here is unfamiliar, the Concepts page explains every idea in plain language; this guide focuses on doing rather than defining.
The How-to guides cover the common jobs one page at a time, with a screenshot of every screen: connecting a warehouse, setting up an alert, investigating a signal, inviting the team.
The four steps build on each other:
| Step | What you do there |
|---|---|
| Plan | Describe the events, fields, and value lists your product should send. |
| Observe | Watch the real numbers your warehouse reports and catch anomalies. |
| Govern | Keep the plan honest against reality, and control who can change what. |
| Connect | Point tripl at the warehouse it reads from. |
Inside a project, the left sidebar groups your work into three areas — Plan,
Observe, and Govern. Connect is the odd one out: wiring up a
warehouse is done once in workspace settings rather than per project, so it
isn't a sidebar group. You will usually set things up in the order Connect →
Plan → Observe → Govern, but explore them in any order. Press ⌘K (or
Ctrl-K) anywhere to search or jump. The palette's Actions group also
starts common tasks: New event, New metric, New branch, switching branch,
Invite member (owners) and the theme toggle.
Before you start
-
Open the app and create the first account on the sign-in screen. The first person to register becomes the owner of the organization (and the instance's platform admin); everyone who registers after that joins as a member, who sees the projects they create or are added to.
Forgot your password?The sign-in screen has a Forgot your password? link. When the instance has email configured (see Email delivery / the SMTP settings), it emails a single-use reset link that expires in one hour; open it to choose a new password. If email is not configured, the same screen tells you to contact an owner, who can reset it for you. To avoid leaking who has an account, the request always shows the same confirmation regardless of whether the address is registered.
-
After signing in you land on your projects. If you already have exactly one project, tripl takes you straight into it; otherwise you see the workspace dashboard.
Everything you see belongs to an organization, and the address says which: the workspace is
/o/{org}and a project page is/o/{org}/p/{project}/…(for example/o/default/p/web/events). Older links of the form/p/{project}/…still work and open the same page in the organization that holds the project. If you belong to more than one organization, the switcher above the project switcher in the sidebar moves you between them; each has its own projects, data sources, API keys and members. Its settings are under Settings → Organization (see the Administration guide). -
From the dashboard you have two ways forward:
- Generate demo project — a complete synthetic project to explore.
- New project — an empty project for your real work.
For your first ten minutes, generate the demo project. It is fully populated and needs no warehouse, so you can learn the product before wiring up any data.
A project is one tracking plan and everything around it — its own events, scans, metrics, and alert rules. Each project also has its own members: only they (and the organization's owners and admins) can see it, and whoever creates a project is an editor member of it. Add people in Settings → Project → Access, as an editor or a viewer of that project. Organization roles (owner, admin, member) and data-source connections are workspace-wide, although API keys can be bound to one project. A company with an iOS app, an Android app, and a website that share analytics is usually one project; two unrelated products are two projects.
Tour the demo project
Generate the demo project and open it. You now have a realistic catalog with events, collected metrics, detector-produced anomalies, and schema/distribution drift — all backed by a local synthetic warehouse, and kept fresh over time.
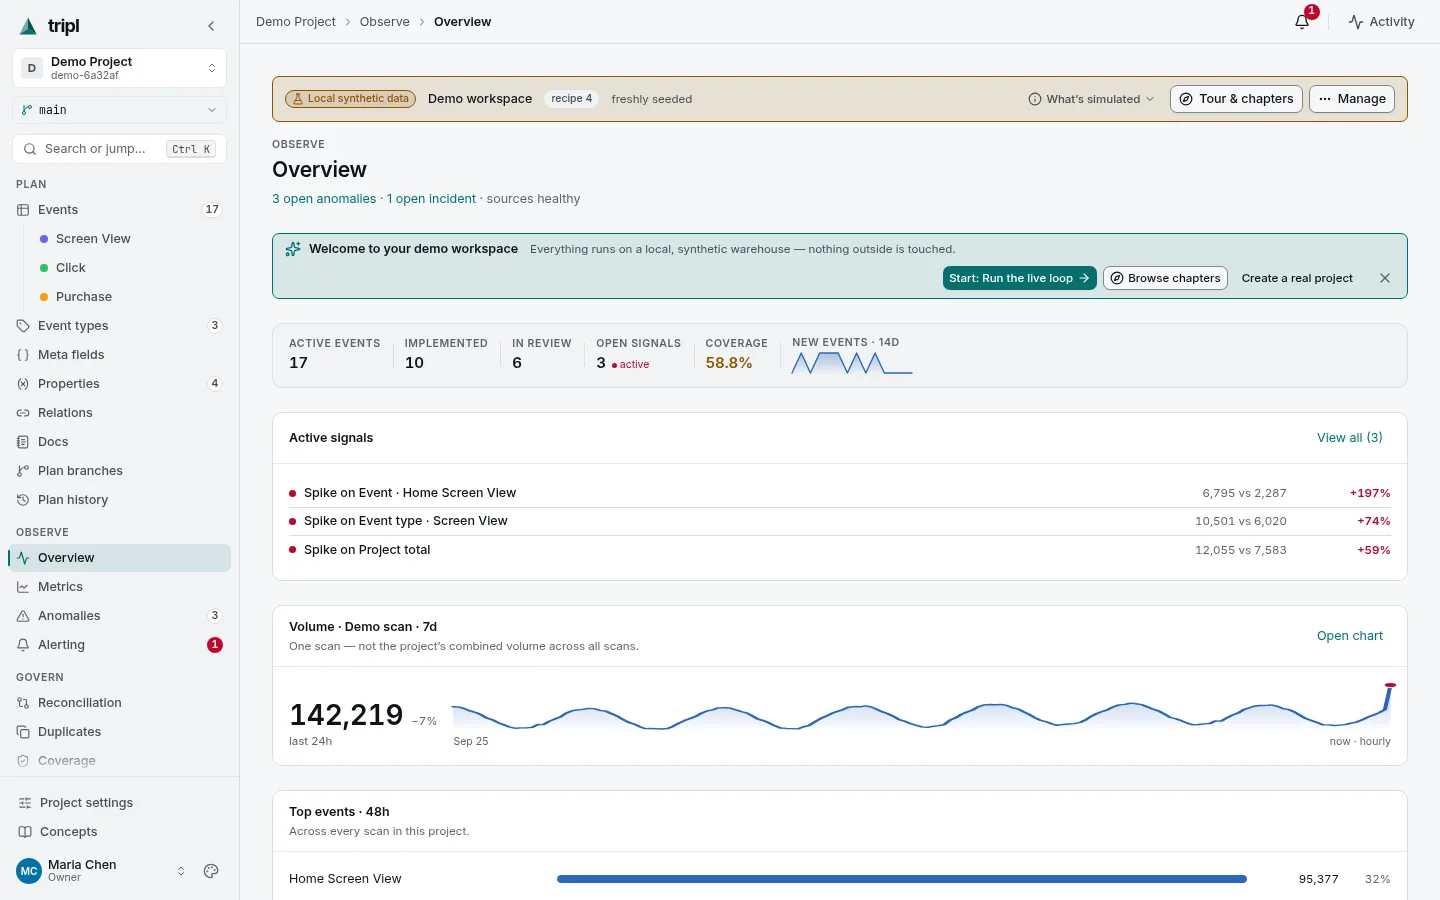
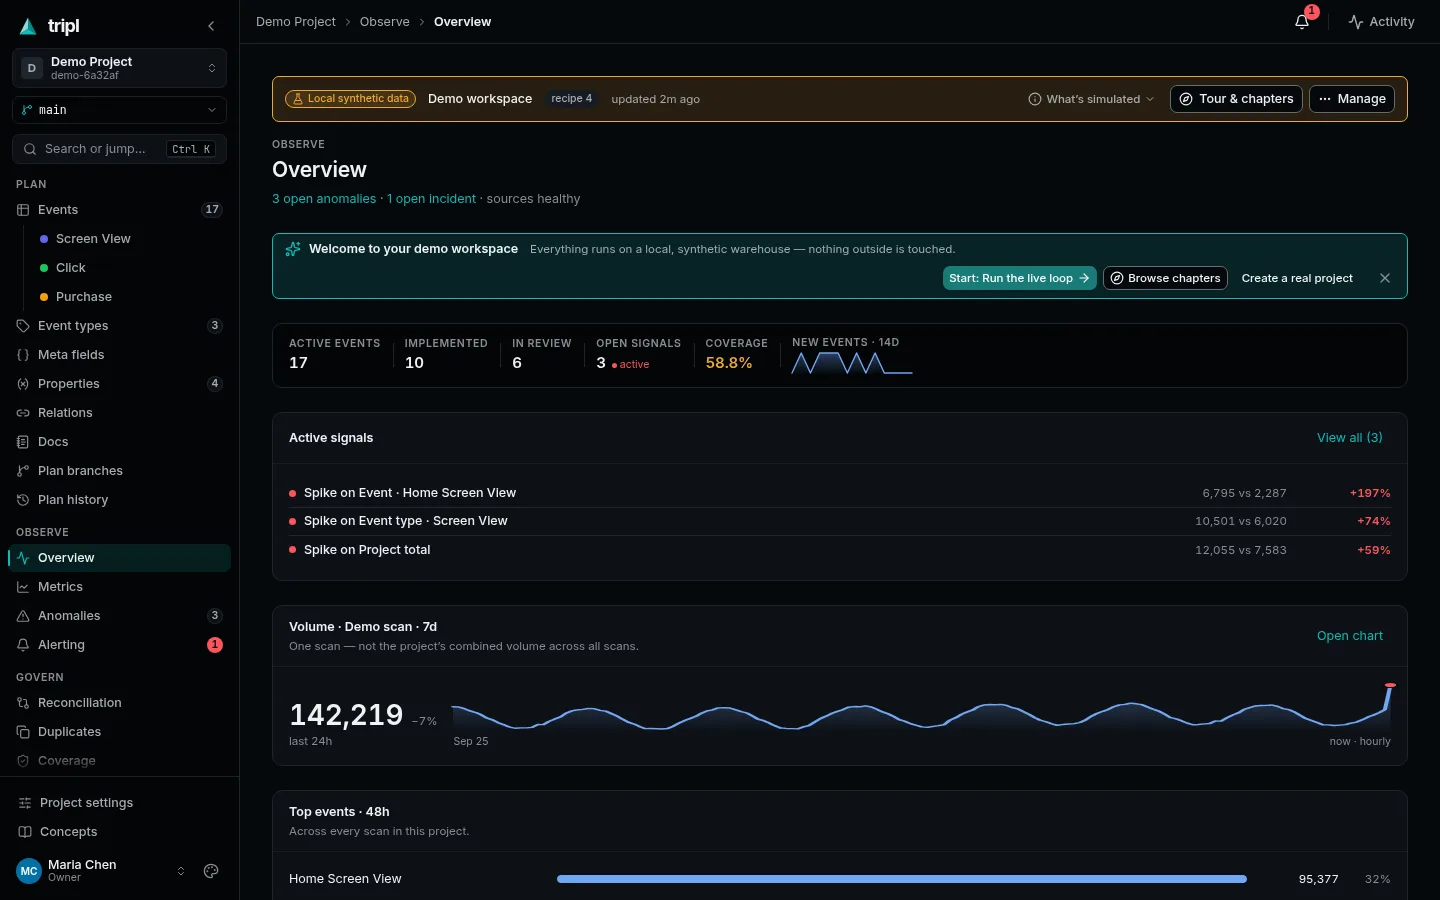
The demo's data lives in a local synthetic warehouse — a bounded, in-memory dataset that never leaves the server and is never a real connection. But the product is not faked around it: real scans, metric collection, anomaly detection, reconciliation, and a continuous runtime clock all run over that synthetic source. Alert deliveries are recorded to a local simulated sink — nothing is ever sent to Slack, Telegram, email, a webhook, Jira, Linear, PagerDuty, or Microsoft Teams. Delete or reset it whenever you like; it never touches your real projects.
See The demo workspace for exactly what is synthetic, what is really executed, and what is intentionally unavailable.
Start with the coached chapters. The welcome panel's Start: Run the live loop opens the first of them, and Browse chapters lists them all — short hands-on lessons, one per product area: run the live loop (scan → metric → chart), edit an event, properties & value drift, review a branch, reconcile the plan, route an alert, and a closing explore chapter. A strip under the demo banner tracks which chapter and step you are on and links to the next action, and a callout rings the button that performs it. Chapters advance on your actions only: the demo's background clock is running scans and collections of its own, and those never tick a chapter forward. Dismiss or restart any chapter whenever you like. (Prefer to read first? Take the tour walks the same surfaces without asking you to do anything.)
Then a good order to look around:
- Plan → Events — browse the catalog. Open an event to see its fields, values, tags, status, and recent change history.
- Observe → Overview — the health of the whole project at a glance.
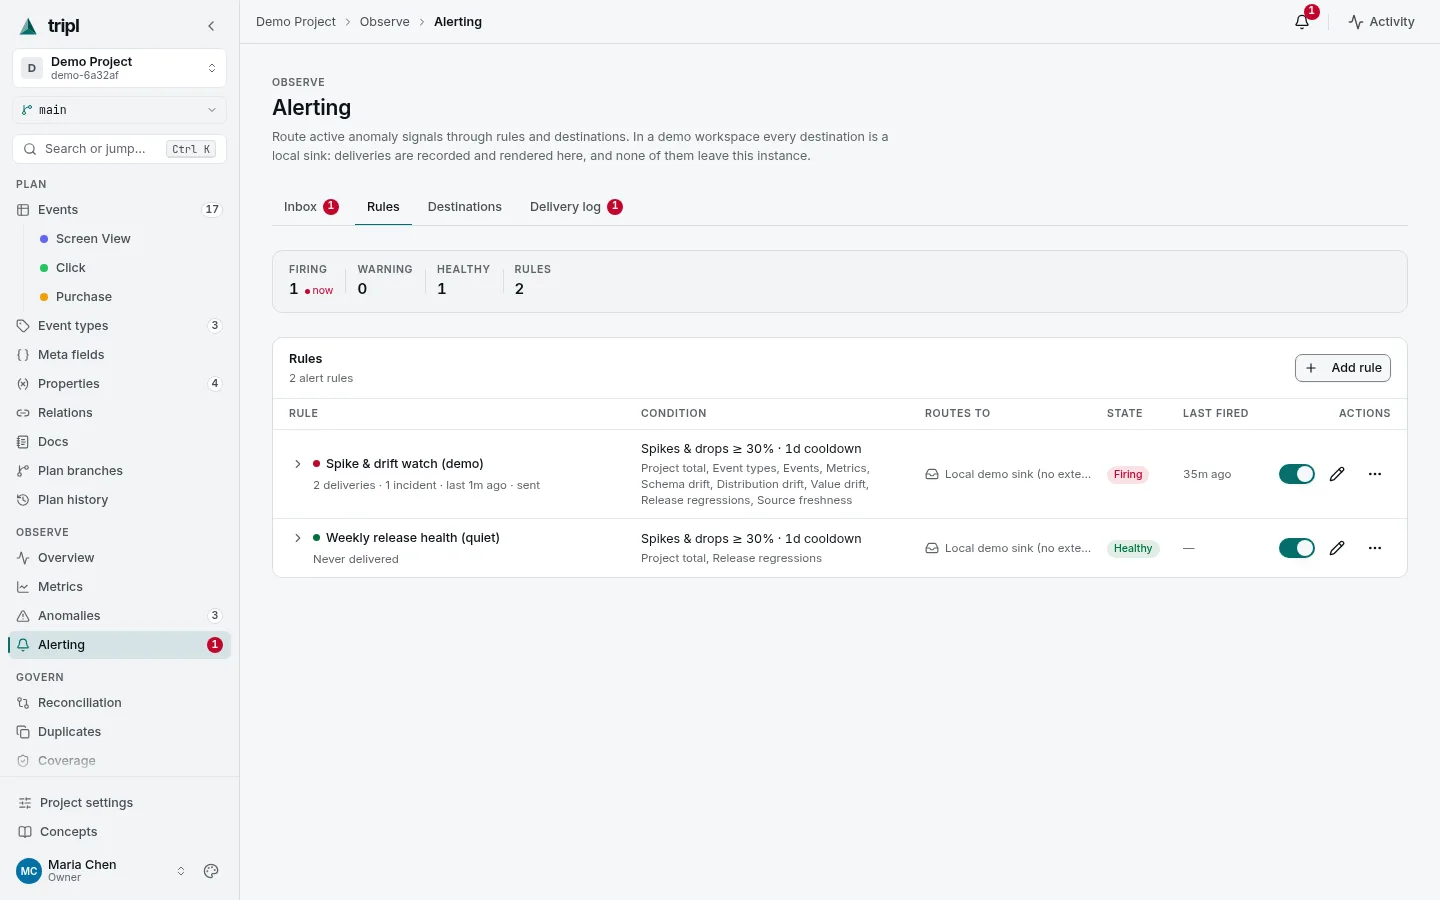
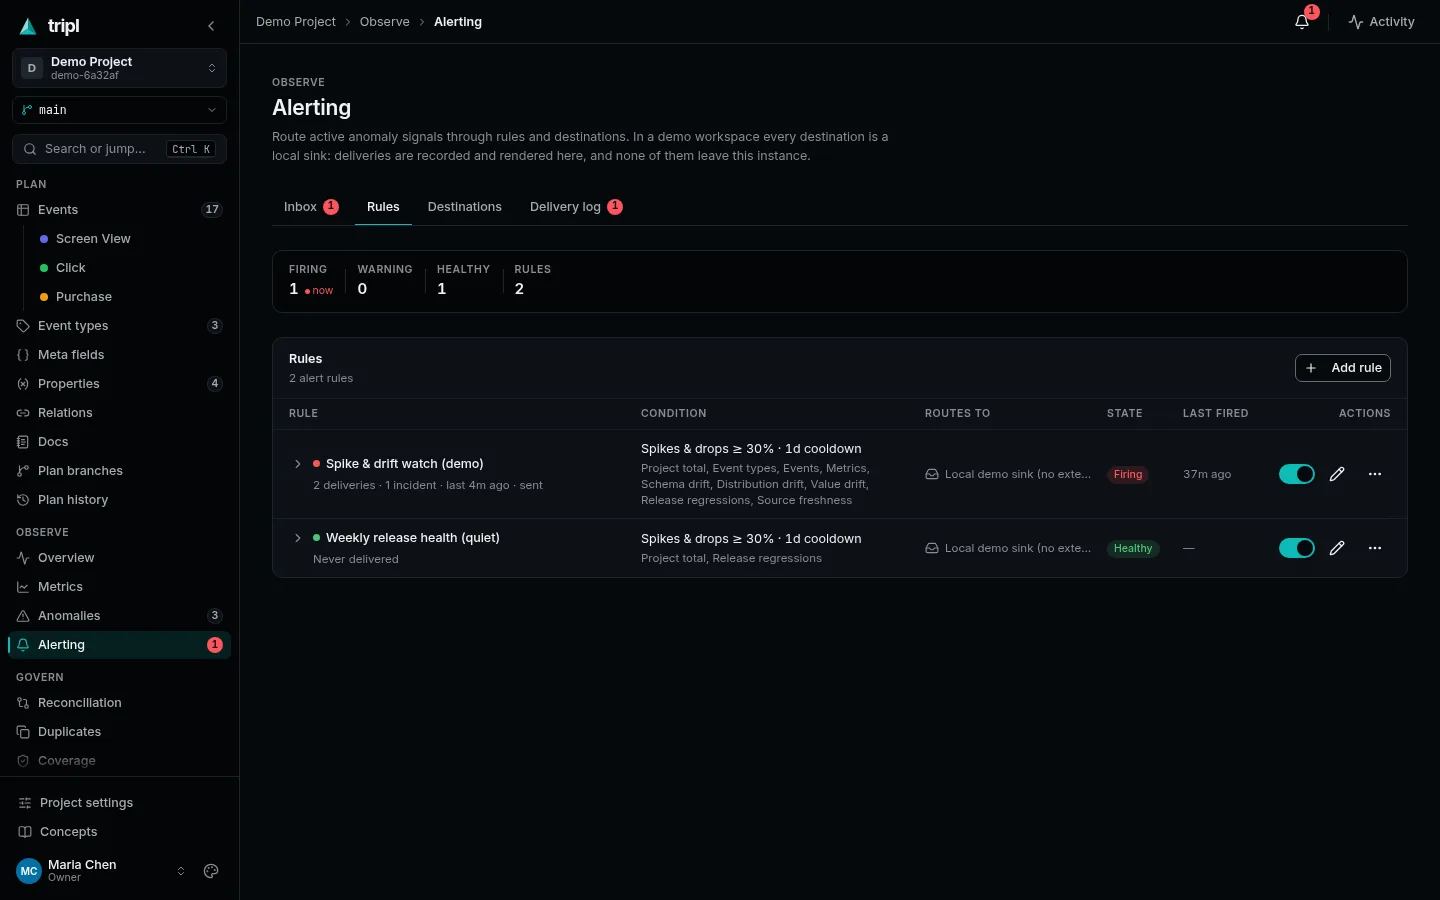
- Observe → Alerting → Rules — see which alert rules are firing and where they route. Then open an event that is showing a signal and study its monitoring detail: the volume chart, the forecast, the heatmap, and the breakdown of what moved.
- Govern → Reconciliation — see what is documented-but-dead and live-but-undocumented.
Once that makes sense, the sections below show how to build the same thing from your own data.
Connect: point tripl at your warehouse
Skip this section entirely if you are only exploring the demo project.
tripl never stores your raw analytics events. It connects to a warehouse you already run, reads from it on a schedule, and keeps only the aggregated counts it needs.
Add a data source
- Open Data sources from the workspace settings area.
- Add a connection for your warehouse — ClickHouse, BigQuery, or
PostgreSQL — and fill in the connection details:
- ClickHouse: host, port (8123), database, username, password. Optionally
pick a JSON path discovery mode for
JSON-typed columns. - PostgreSQL: host, port (5432), database, username, password. Version 14
or newer is required — tripl buckets time with
date_bin(), which older servers do not have, and the connection test refuses them. Optionally set an SSL mode, a CA / client certificate, and a search path. - BigQuery: GCP project ID, a default dataset, and a service-account JSON key pasted into the form. Optionally set the dataset location, a max billed bytes cost guard (100 GiB by default), and a dataset allowlist for the schema browser.
- ClickHouse: host, port (8123), database, username, password. Optionally
pick a JSON path discovery mode for
- Every warehouse — BigQuery included — accepts a query timeout in seconds (300 by default).
- Save, then click Test on the connection card.
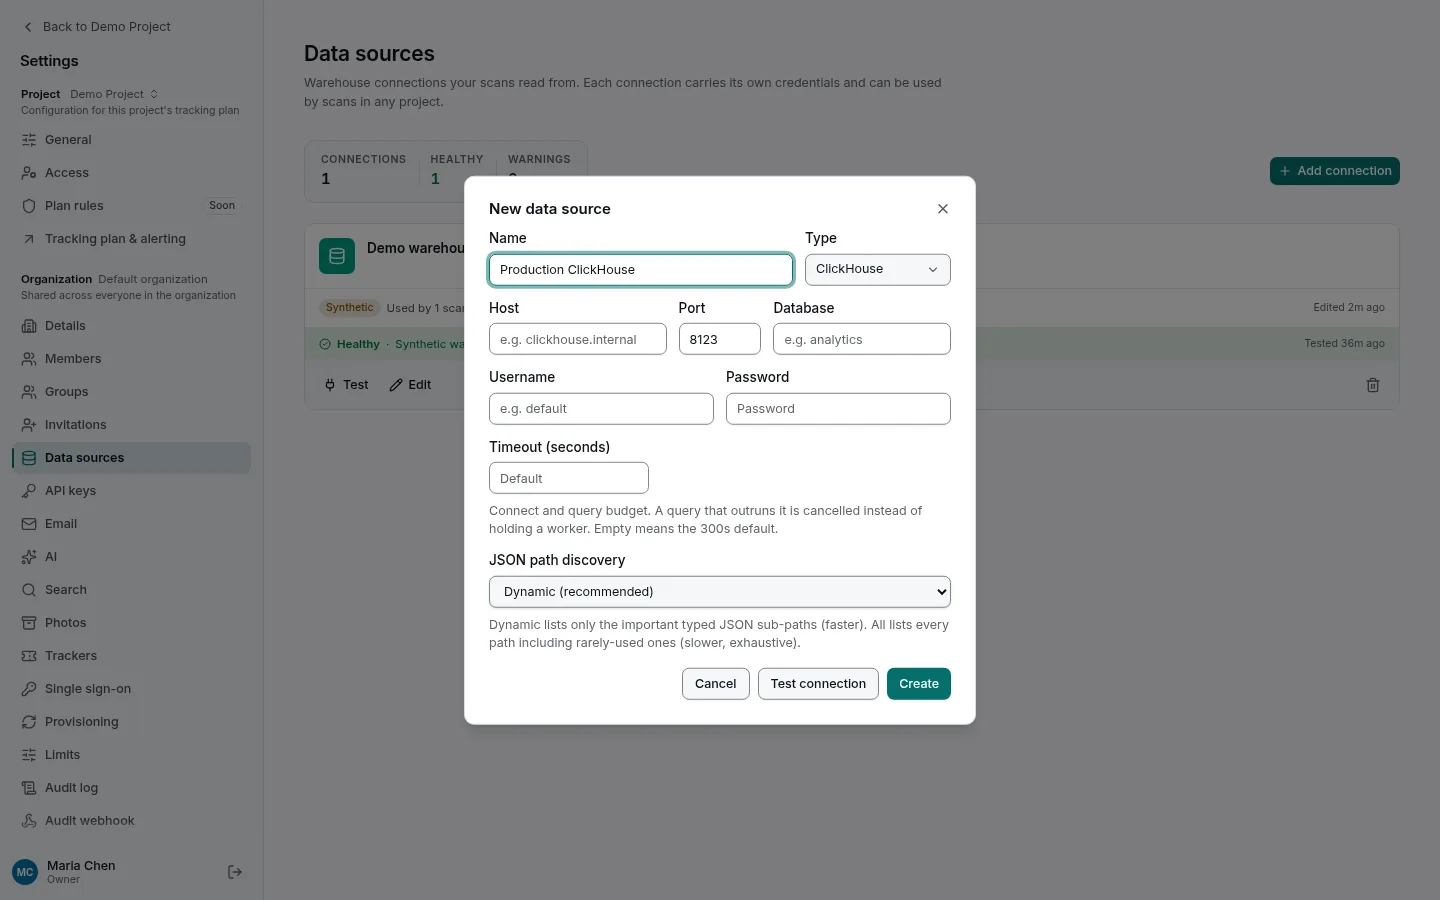
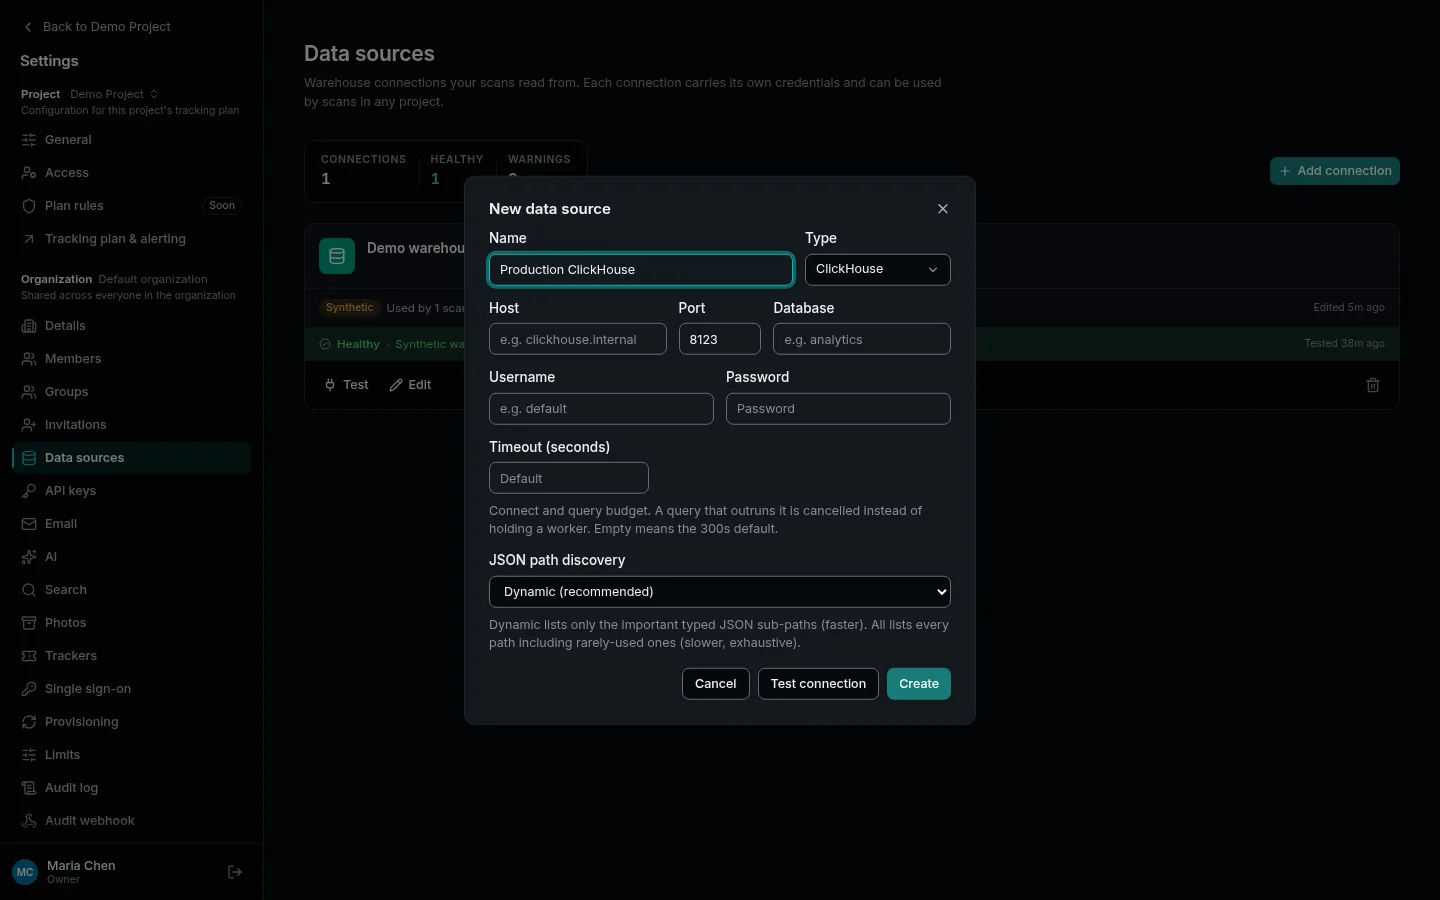
tripl only ever reads from the warehouse; it never writes to it.
They support the same features, but not with the same guarantees. ClickHouse and PostgreSQL are verified by executing tripl's generated SQL against real servers in CI; BigQuery's SQL is verified as valid by Google's own ZetaSQL analyzer, but its computed values have never been executed against real BigQuery. There are also real differences in supported time-column types, nested JSON behavior, TLS defaults and minimum versions.
Before you commit to a warehouse, read the warehouse capability matrix. It states, per capability, what is proven, what is merely believed, and what is bounded — plus per-warehouse setup requirements, permissions and dialect-correct SQL examples.
Left unset, SSL mode resolves to require for remote hosts and prefer
for localhost. An explicit prefer uses TLS if the server offers it and
silently falls back to plaintext if it does not, and require encrypts
without checking the certificate — to also authenticate the server, choose
verify-full and supply a CA certificate.
Connecting, editing, testing, and deleting data sources is restricted to the organization's owners and admins. Members — project editors and viewers — can use the events that a scan produces but cannot change the connection itself. Data sources live in workspace settings and are shared across the workspace rather than scoped to a single project.
Read the connection health
Each connection card shows the result of its last test, led by its health word (healthy / stale / failing, or an "untested" chip before the first test). A new connection is tested as soon as you create it, and an edited one is re-tested when you change its host, credentials or TLS settings. The Warnings count at the top includes stale checks as well as failed ones.
- Green — the last test succeeded recently.
- Amber — the last successful test is now stale (older than seven days), so tripl no longer treats it as a confident "healthy". Click Re-test connection to refresh it.
- Red — the last test failed; the card shows the error message and offers Re-test connection and Edit connection inline.
A successful test means tripl can reach the warehouse right now. Connections can silently break later (rotated credentials, network changes), which is why tripl greys out stale "healthy" checks instead of leaving a permanent green light. Re-test if anything looks wrong.
Plan: write down what should be tracked
You can write the plan by hand, let a scan draft it from real data, or — most commonly — do a bit of both.
Option A — let a scan draft it
- Create a scan that points at the warehouse table where your events land.
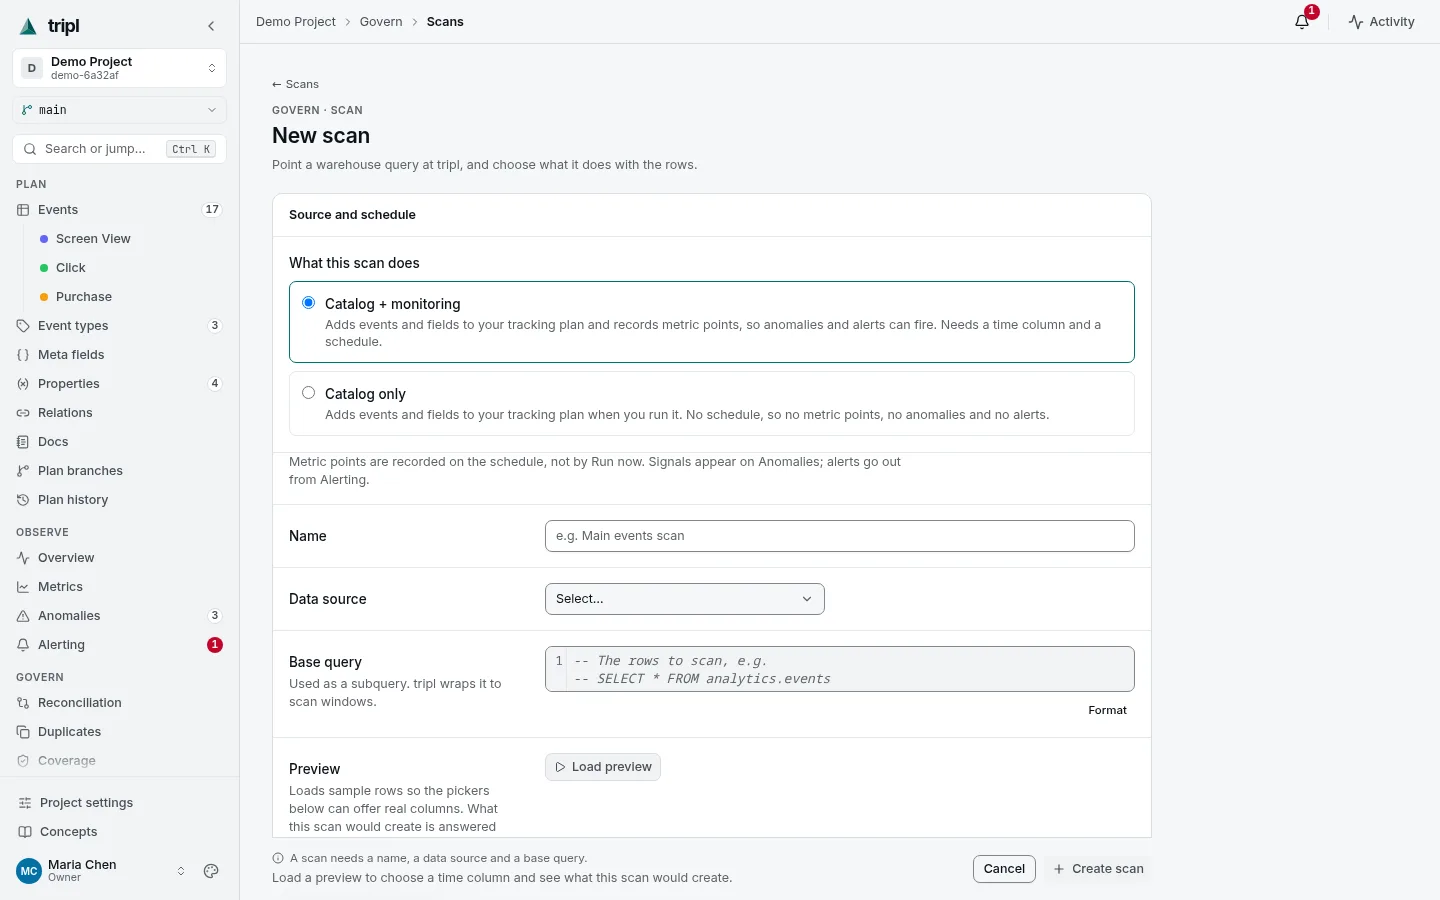
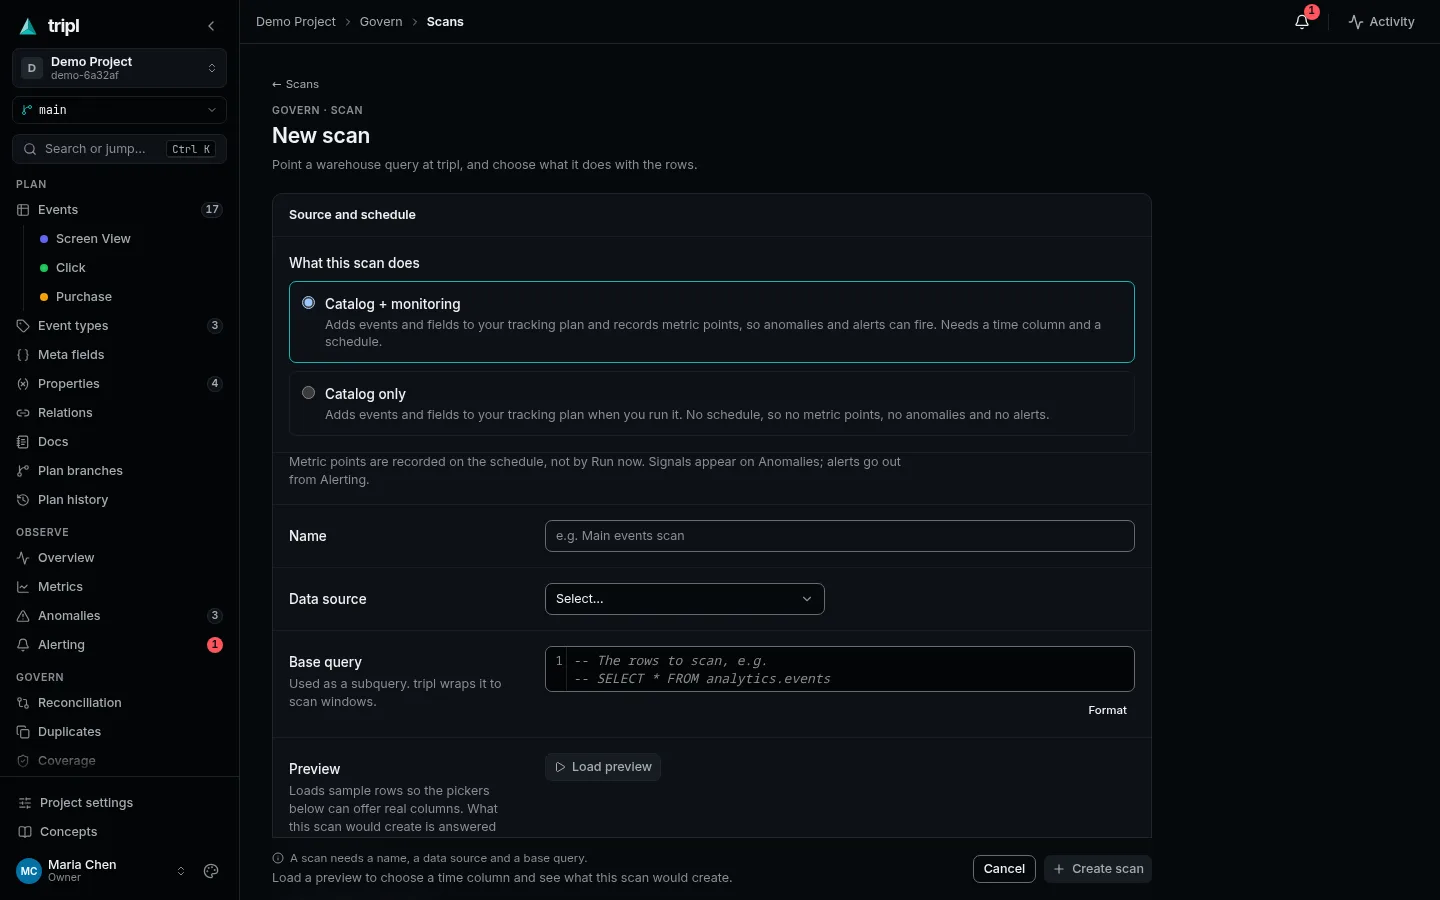 2. Load the preview to see the event names and fields tripl would create
from the real data — worked out by the same planner a real run uses, and
bounded by the window and sample it says it read — then run it.
3. The scan proposes events, fields, and value lists from what it actually
found. Keep what makes sense and adjust the rest.
2. Load the preview to see the event names and fields tripl would create
from the real data — worked out by the same planner a real run uses, and
bounded by the window and sample it says it read — then run it.
3. The scan proposes events, fields, and value lists from what it actually
found. Keep what makes sense and adjust the rest.
Set the scan's Event name format when event identity is assembled from field
values (for example {action}:{category}). The same template governs manual
creation for that event type: the event form previews the generated name and
requires every referenced field. This prevents a hand-written event and its
scan-generated counterpart from becoming two different catalog rows. A row whose
format resolves to nothing — every column it names was NULL for that row — is
skipped rather than becoming a nameless event, and the run report says how many:
Skipped N rows whose derived event name was empty.
This is the fastest way to turn an existing warehouse into a written plan, and it is what populates monitoring later.
Option B — write it by hand
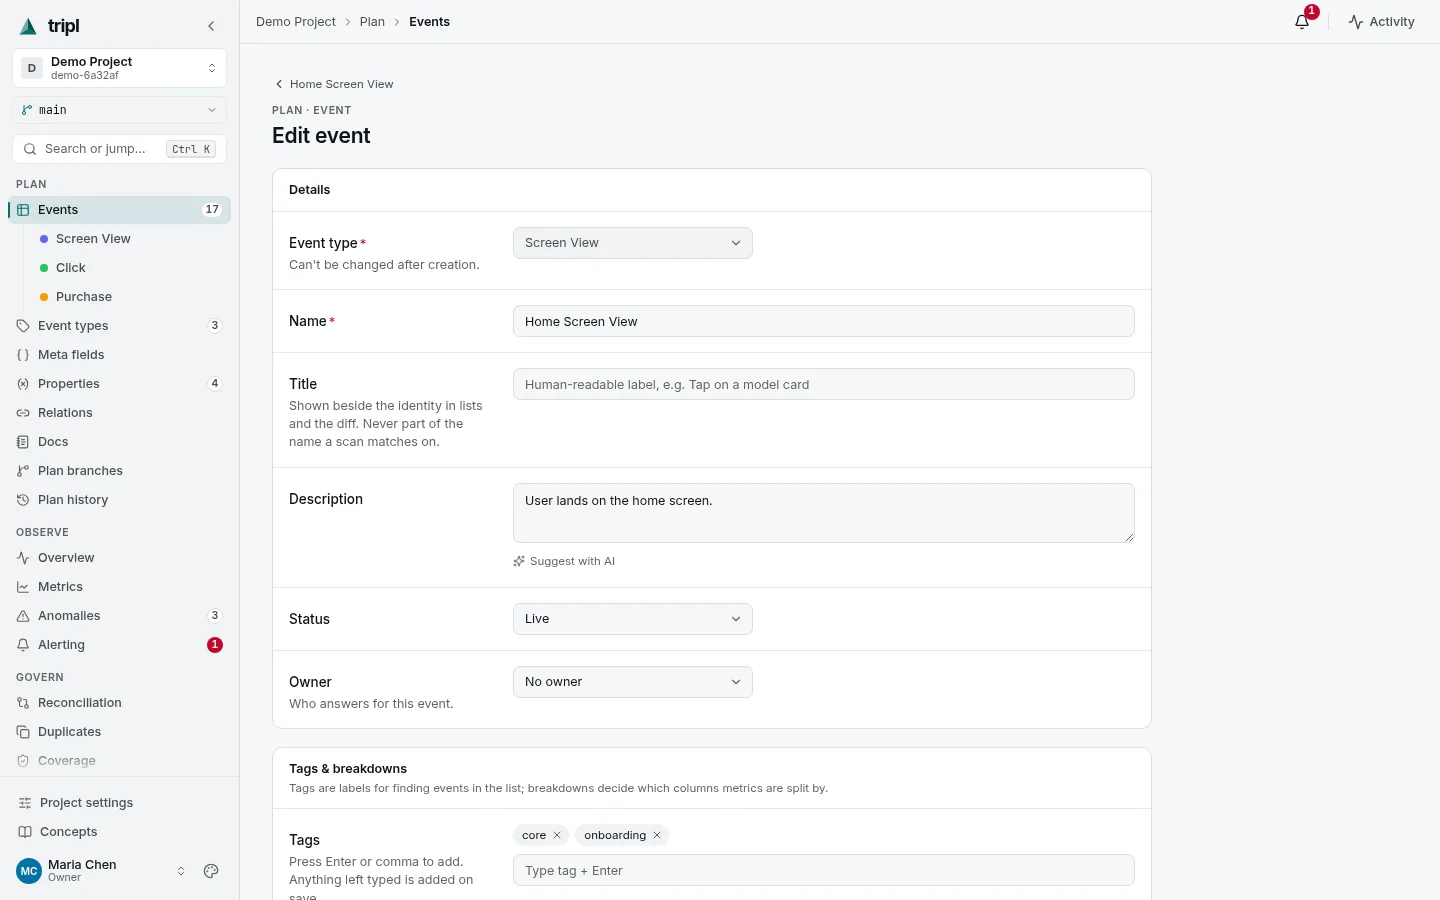
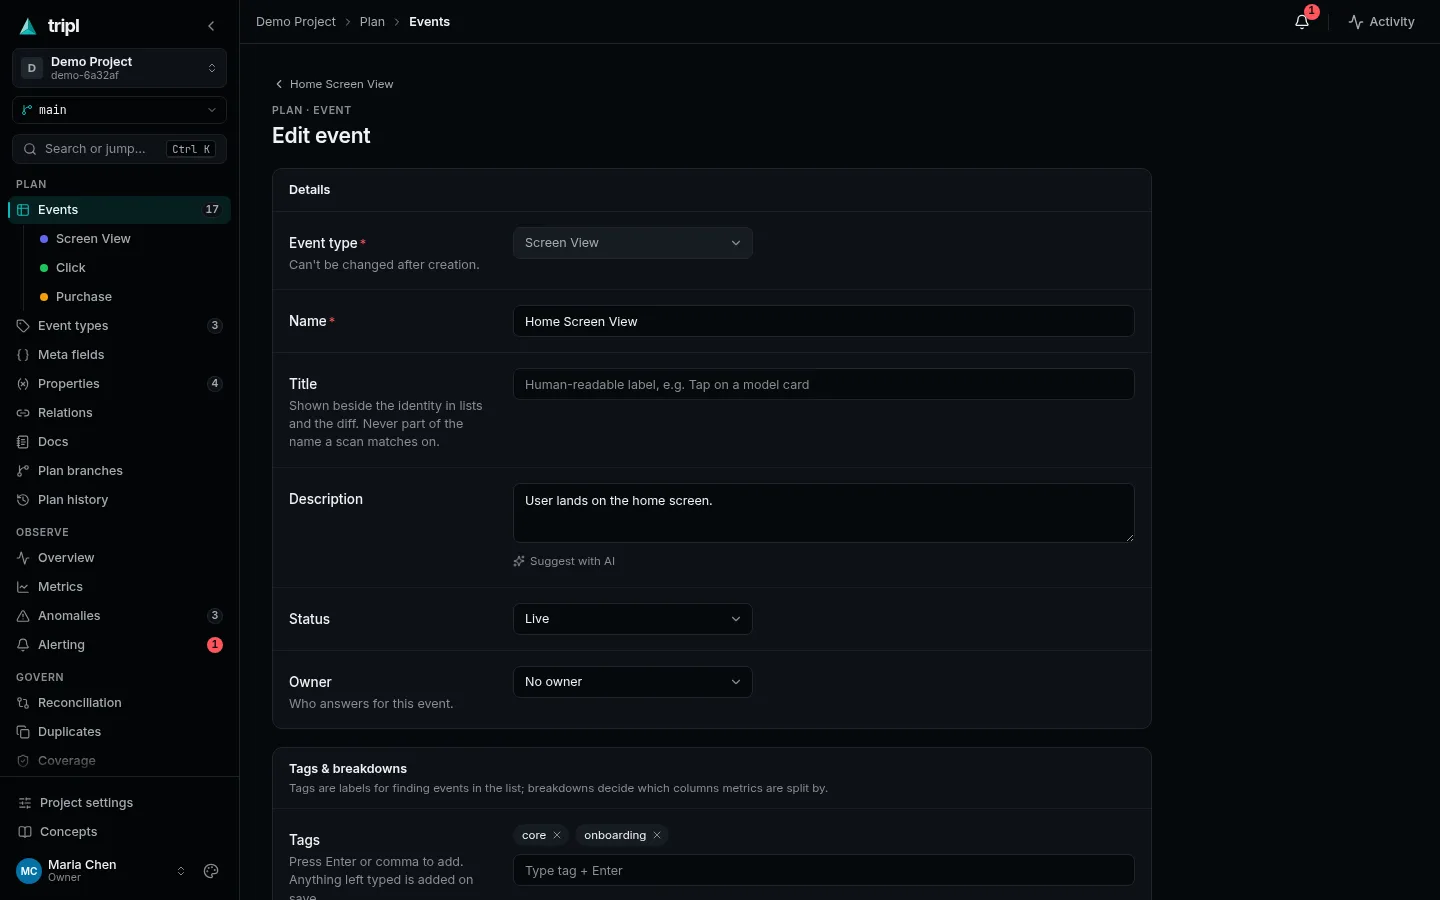
- Event types — create folders for related events (for example
Commerce,Onboarding) so a catalog of hundreds of events stays organised. - Events — add events, give each a clear description, and attach the
fields it carries. Mark any field that holds personal or sensitive data.
Where a scan names the events of a type, the Name is written for you
from the field values and is the identity collection matches on — put the
human-readable label in Title instead (
Order paid,Video started). The title shows beside the name in lists, the diff and the event page, is searchable, and can be changed at any time without touching the identity. - Meta fields — define meta fields that ride along with every event (app version, platform, country), reusable properties for templates you use in more than one place, and relations that record how one event is expected to follow another.
Reuse values with properties
Create a property under Plan → Properties, document the values the team
expects, and add the warehouse column or dotted JSON path that supplies it. Use
${variable_name} in event field or meta values; the event form shows matching
properties, documented values, and warnings for unknown tokens. A JSON field
must be valid JSON; tripl saves its canonical JSON form while preserving complete
template values such as ${variable_name}.
Scans keep observed samples separate from the documented list, and the samples accumulate — a re-scan merges what it saw into the stored evidence instead of replacing it, so a value observed once does not vanish when later scan windows stop carrying it. If a new value appears, review the drift from the Properties table or the affected event: accept it globally, accept a complete override for that event, snooze it, or mark it a false positive. If a scan-created property should stay out of the plan, choose Exclude from scans instead of delete so the next scan does not recreate it.
Scans also clean up after themselves: each catalog run deletes the properties it
created that nothing refers to any more — no ${token} left in any event field
or meta value, no observed values, no drift, no override. Anything you renamed,
edited, documented, or excluded is left alone, and so is a property a single ${token}
still names. See Properties & templates for the
full workflow.
Move events through their lifecycle
As events get built and verified, move them through their statuses — Draft, In Review, Ready for Dev, Implemented, Live — and Deprecate or Archive the ones you retire. The last step happens on its own: the first data collection sees for an event in Ready for Dev or Implemented moves it to Live. Draft and In Review events stay put, so stray traffic never promotes an event nobody has signed off on, and so does an event with a required field left empty. The promotion records when the event was first seen, adds a history entry and an activity-rail entry signed tripl (scan), and comments on the event's implementation ticket if it has one. It happens on main only and does not wait for branch review: it records that the data arrived, not a plan edit (see Going live on its own).
Retiring an event is watched too. Once a day tripl looks for a deprecated event still receiving traffic after its sunset date, and for one whose Replaced by event has received nothing for 7 days. Both findings flag the deprecated event — it carries the lifecycle chip in the catalog and lists the finding on its page, naming the quiet replacement where that is the problem — and a deprecated event's page shows the migration as Old 1,240/day → New 3,800/day. See Sunset watch.
Verification is tracked separately: mark an
event verified once you've checked it, independent of its status. The two
axes really are independent — an event can be verified and still sit in
In Review — which is why the header's In review stat counts events whose
status is in_review, and not the events nobody has reviewed yet. On the
Events page you can select several rows at once and use the bulk action bar to
set status, mark as verified, assign an owner (or Unassign, the
same picker's first entry, which clears the owner across the selection), or
delete in one go.
Saved views, column toggles, and filters (by status, tag, silent days, verified
state, or field value) help you work through a large catalog.
The Status filter takes several statuses at once — tick Draft and
In Review to see both. Each lands in the page URL as its own ?status=
parameter, so the combination survives a reload or a shared link. With nothing
ticked (Any status) the list shows every status except Archived — or,
on the review and archived tabs, the status that tab is for; tick Archived
to see archived events alongside the rest.
The toolbar's Verified filter takes Any, Yes or No and lives
in the page URL — ?reviewed=true or ?reviewed=false, with Any writing no
parameter — so "what still needs checking" can be bookmarked or sent to a
colleague. Verified is a flag of its own, separate from the In review
status: Mark as verified does not take an event out of the review queue.
The Verified column is off by default in the column picker, but it is forced
visible on the Review queue tab (/events/review), where the flag is the
point of the screen and a bulk Mark as verified would otherwise change
nothing you could see.
A few more things about the Events page:
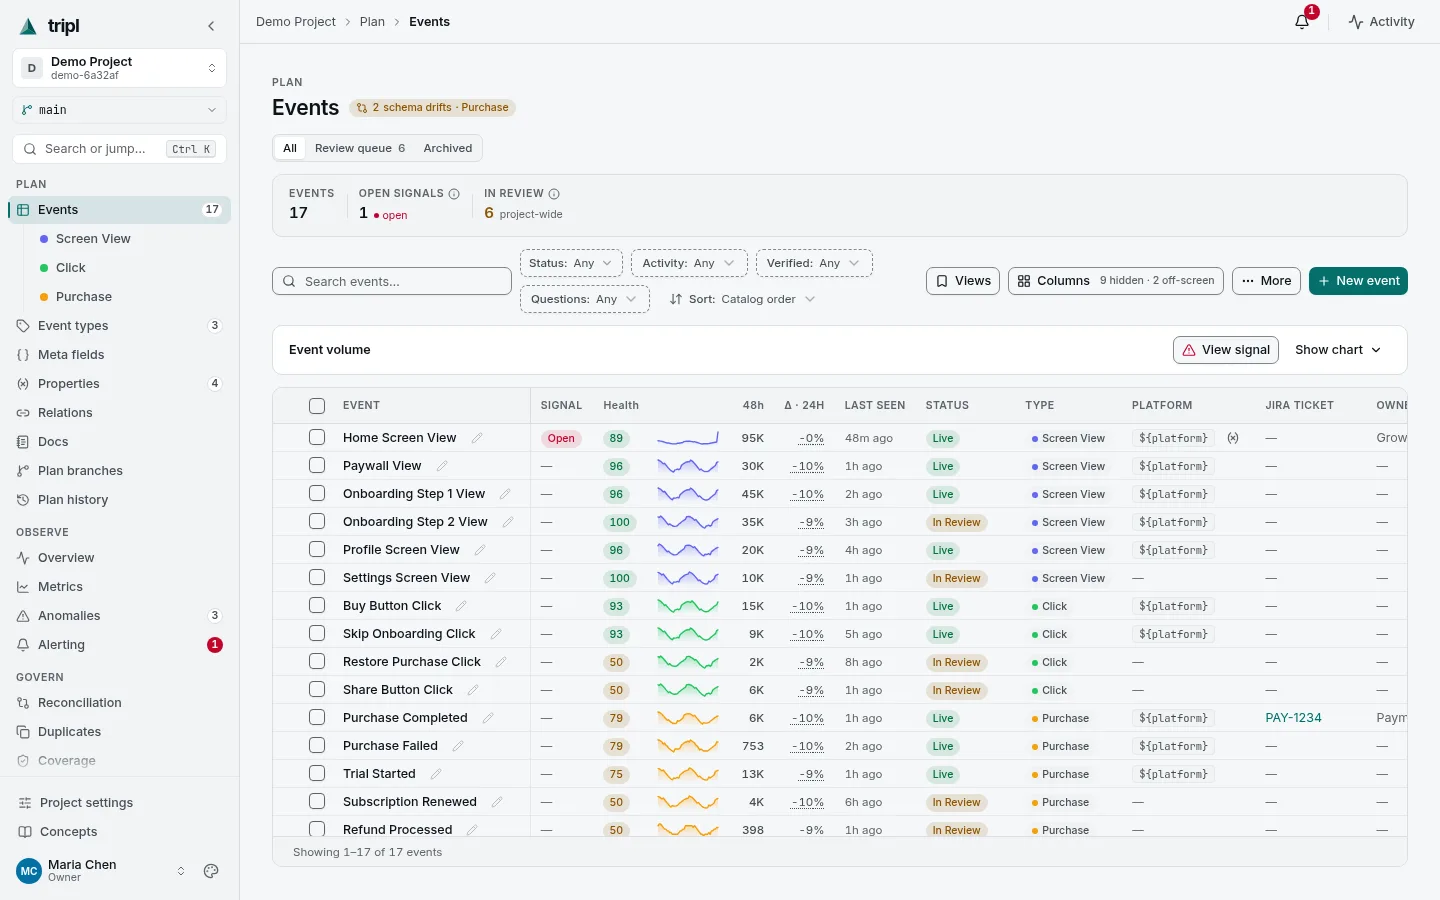
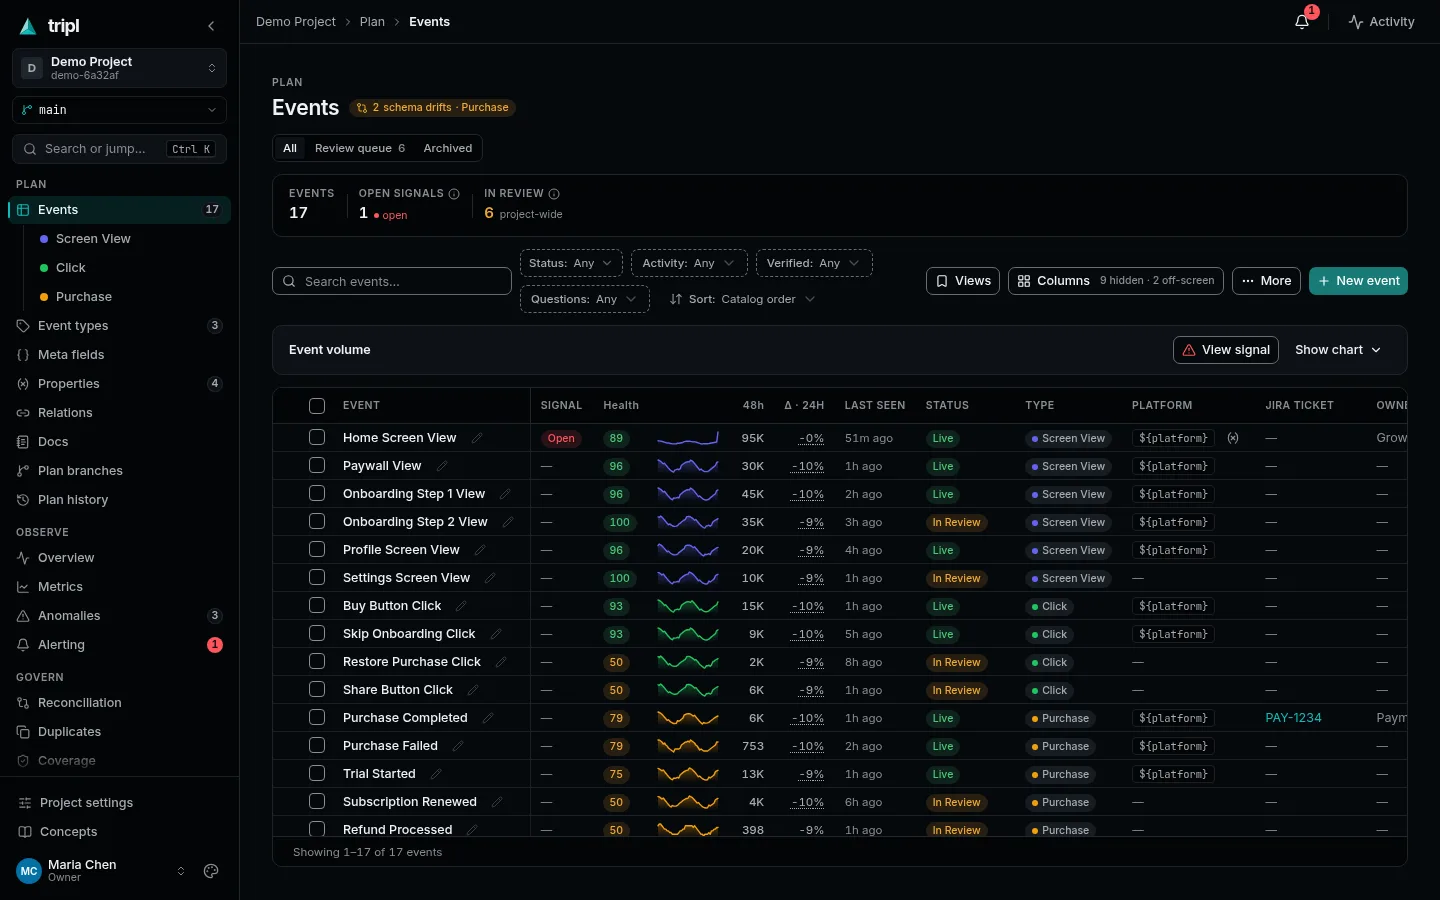
- A row under the title switches between All, Review queue (n) and Archived; on the last two the page is titled Review queue and Archived events. The In review stat in the header links to the queue.
- The Event volume chart starts collapsed. Ranges longer than 7 days group by day, and an open signal is marked on the chart.
- Clicking the 48h column header toggles Busiest first.
- Clear filters clears the search box too.
- On a phone the filters fold behind a Filters (n) button.
- On the All tab, type-specific field columns start hidden; turn them on in Columns.
- Clicking a row opens the event's page. Its header's Discussion (n) chip jumps to the event's comment thread, and while the event is unverified the ⋯ menu offers editors Mark as verified, the list's bulk action for this one event.
- Saved views are kept in your browser and hold the search, filters and sort.
- A viewer who follows a link to an event lands on its monitoring detail page.
- A new project shows a first-run state offering New event, Import from a scan and Add many events.
Plan safely with branches
Once a plan is live and people trust it, stop editing it directly. Change it on a branch instead — the same idea as a pull request for code.
-
Open Plan branches and create a new branch (or pick New branch from main in the branch switcher). You get a private copy of the whole plan, and by default you are switched onto it as soon as it is created.
-
Make your changes on the branch. A branch switcher keeps every plan page in that branch's context, so the live (main) plan is untouched while you work.
-
Assign a reviewer with Reviewer and press Submit for review. tripl does not notify a reviewer when they are assigned — no email and no in-app message — so send them the branch link yourself.
-
The reviewer reads the diff — exactly what changed on the branch since it was created. Changes that landed only on main appear as the branch being behind, not as branch changes. Each row expands to the field-level detail: collections such as an event's field values, meta values and tags are broken down member by member (
currency: USD → EUR), and the row links straight to the event, event type, or property it describes, opened in that branch. The selected branch lives in the page URL, so a review can be shared as a link. The reviewer leaves named comments and either requests changes or approves.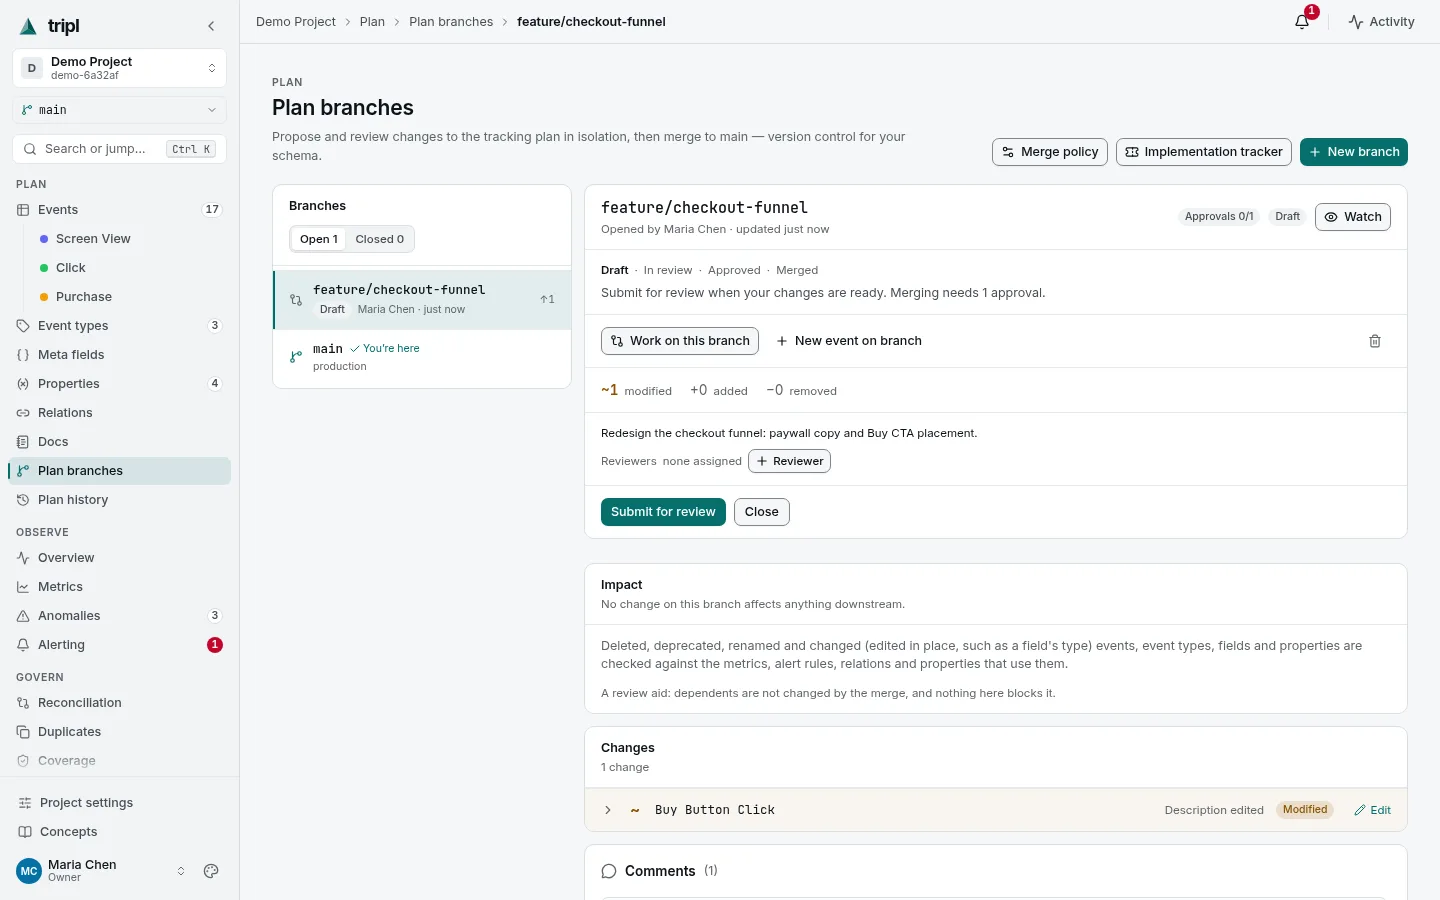
-
Merge. tripl matches events by name, so nothing is duplicated and the metrics, history, and alerts already attached to an event stay attached. Non-conflicting edits on either side merge automatically, including child state such as values, tags, photos/comments, overrides, and breakdown settings. If both sides changed the same state differently, merge reports a conflict.
Update from main. When main has newer changes, the branch shows a note under its change counts: neutral ("safe to merge") when main changed other entities only, amber when main also changed something the branch changed. Update from main brings main's newer changes into the branch without touching your own. The dialog lists what main brings per entity type, then every overlap — a field, event, property, meta field, relation or event type that both sides changed — with two choices each: Keep this branch or Take main. When one side deleted something the other side edited, the choice is between keeping it and deleting it (or restoring it); taking main's deletion of an event type also removes what the branch added or edited under it. The update runs once every overlap has a choice, and afterwards the branch counts from main as it is now: kept values stay in the diff as branch changes, taken values leave it. Approvals given before the update need renewing. A branch created before complete merge baselines existed cannot be updated; copy its changes to a new branch.
Handing a branch to a developer works the same way: send the link. Catalog
rows, diff rows and the command palette keep the branch in the URL
(?branch=), and an event opened from such a link shows a banner naming the
branch, so the developer reads the right copy rather than main's. On that
event's monitoring page, an event that is not yet live shows a Spec card —
the identity with a copy button, the fields with the ones that name the event
marked, documented property values and an example payload — with Copy as
JSON / Copy as Markdown for the ticket. If a diff row carries a warning
that an event on the branch has no scan identity, fix that before merging:
such an event would never match its traffic.
If an event type has owners, merging a branch that adds, removes, or edits the type itself (display name, description, color, order) requires a sign-off from one of them. Changing only its fields or events does not.
Owners can make review stricter under Plan → Plan branches → Merge policy: require several distinct approvals and block authors from approving their own branch. Approvals are tied to the reviewed plan hash, so any later content edit makes them stale and requires review again. Settings → Project → Plan rules lists these gates in one place. Organization-wide rules (naming, forbidden properties, sensitive fields, a protected main) are plan governance, an Enterprise feature.
Optionally configure the Implementation tracker from Plan branches, in
Jira or Linear (a switch on the settings page picks one; Linear needs a
team id and an API key; switching between them clears the stored token or key,
so enter the new tracker's credential when you switch). After a merge, tripl creates one implementation ticket
for added/changed events and polls it in the background; when the tracker reports
it done — Jira's Done category, or a Linear state of type completed — those
events advance to implemented unless they are already further along the
lifecycle. This tracker is separate from a Jira or Linear alert destination,
which opens incident tickets from monitoring signals.
The notes below describe Jira. Each ticket tripl opens there carries a label naming the branch it came from
(tripl-branch-<id>), and tripl looks for that label before opening one. Jira's
create call has no idempotency key, so if a worker dies between opening the issue
and recording it, that label is the only way the retry can tell the issue already
exists rather than opening a second one — leave it on the issue. Two caveats
worth knowing: Jira indexes new issues asynchronously, so a retry within seconds
of the first attempt can still miss it; and if the search itself fails tripl
opens the ticket anyway, because a duplicate you can see and close beats a merged
branch with no ticket at all.
Select the merged branch to reach its ticket: the Implementation ticket
panel on the branch detail shows the ticket key as a link that opens the issue
in the tracker, and a chip that flips from Open to Done once the background poll
sees it closed. Branches that opened no ticket show no panel.
Undo one change on a branch
A branch is not all-or-nothing. Expand any row in the diff and press Revert to put that change back to the state the plan was in when the branch was opened:
- a change the branch added is discarded — the entity is deleted from the branch;
- a change the branch edited is written back, either every field at once or one field at a time (each field-change row has its own Revert);
- an entity the branch deleted is restored, together with its field values, meta values, tags, and per-event overrides.
Reverting only ever touches the branch — main is left alone — and it works while the branch is open: a closed branch has to be reopened first, and a merged one stays read-only. Neither takes any other plan edit (a closed one until it is reopened), photos and Figma specs included; comments still work. Some things are refused rather than half-done: an event's photos are not restored (their files are not part of the plan snapshot); a field or event cannot come back before the event type it belongs to, so restore the event type first; and a change the revert cannot pin on one row, because several events share its name or several answer to the successor it would restore, is refused. If the plan already held those events when the branch was opened, undo the change by hand: renaming one on the branch does not help. Renaming (or removing) one helps only when the branch itself added the duplicate.
Branch best practices
- One branch per change. Keep a branch focused on a single addition or cleanup so the diff is easy to review and quick to approve.
- Review before merge, always. The diff and reviewer step exist precisely so the live plan is never half-finished or broken.
- Keep main releasable. Treat main as the version analysts and alerts rely on; do experimental work on branches.
- Know which renames a merge understands. A merge matches rows by name, so a
rename can read as deleting one row and adding another — which strands what
hung off the original: its metrics, its change history, the property values
observed against it, and any alert filter that named it. Spec photos are
the exception, because they travel in the plan snapshot: the merge re-attaches
them to whichever row ends up holding the name.
- A row a scan discovered survives it. tripl remembers the name such a row arrived under, and a merge uses that remembered name to recognise a rename and move the existing row instead of replacing it. Renaming a scanned event or a scanned property on a branch is safe.
- A row with no remembered name does not. An event written into the plan by hand and a property you added yourself have no scanned name behind them, so nothing identifies them across a rename and they still merge as a delete plus an add. Neither does a rename tripl cannot pin to one row — two events under the same event type sharing a remembered name are left alone rather than guessed between.
- Everything else reads as delete-plus-add whatever its history: renaming an event type, a field, or a meta field, and moving an event to a different event type, which is a move rather than a rename and is applied as one.
- For the renames that do not survive, edit the description, fields, or tags instead of renaming when you can; when you cannot, expect to re-attach anything the old row carried.
Recovering from a mistake
The branch review step is your best protection — it is far easier to catch a
mistake in a diff than to unwind it afterwards. Before a merge, any change on
a branch can be reverted from the diff (see Undo one change on a
branch). After a merge there is no "undo merge"
button, and deleting an event is permanent: an event and its change history are
removed outright — the Audit log keeps an event.delete row naming who
deleted it and when, which tells you what happened but does not make the values
recoverable — and its collected metrics are keyed to the event internally, so
re-creating an event with the same name produces a new event with no prior
metrics or history. Post-merge recovery is manual.
If something lands on main that shouldn't have:
- A wrong edit or merge — open the Audit log (under Govern) to see exactly who changed what and when, then make a follow-up branch that sets the values back and merge it through review. An action older than the first page is still reachable: page back with Older (or narrow the filter first). An audit row also shows which branch the write was made in — a chip naming the working branch, or no chip for a write that was not branch-scoped (main, or an action with no branch to name at all) — which is how you tell a branch edit that arrived through a merge from someone editing main directly while tracing a wrong change. Event creates, edits and deletes are in this log too, with the branch chip like any other plan write. Each event also has its own field-level change history on its detail page, which is where the before and after values live and which helps you work out what the correct values were — that history is removed with the event, while the audit row survives it.
- A deleted event — re-create its definition by hand (description, fields, tags) and let monitoring start collecting again from the next scan. The deleted event's earlier metrics and history are not restored.
Write down what the plan cannot say: Docs
Some knowledge does not fit in an event definition: which warehouse table
double-counts retries, how to query a checkout funnel, why a field is in cents.
Plan › Docs keeps it as Markdown notes next to the plan, for people and for
AI agents (they read the same notes through MCP and tripl docs).
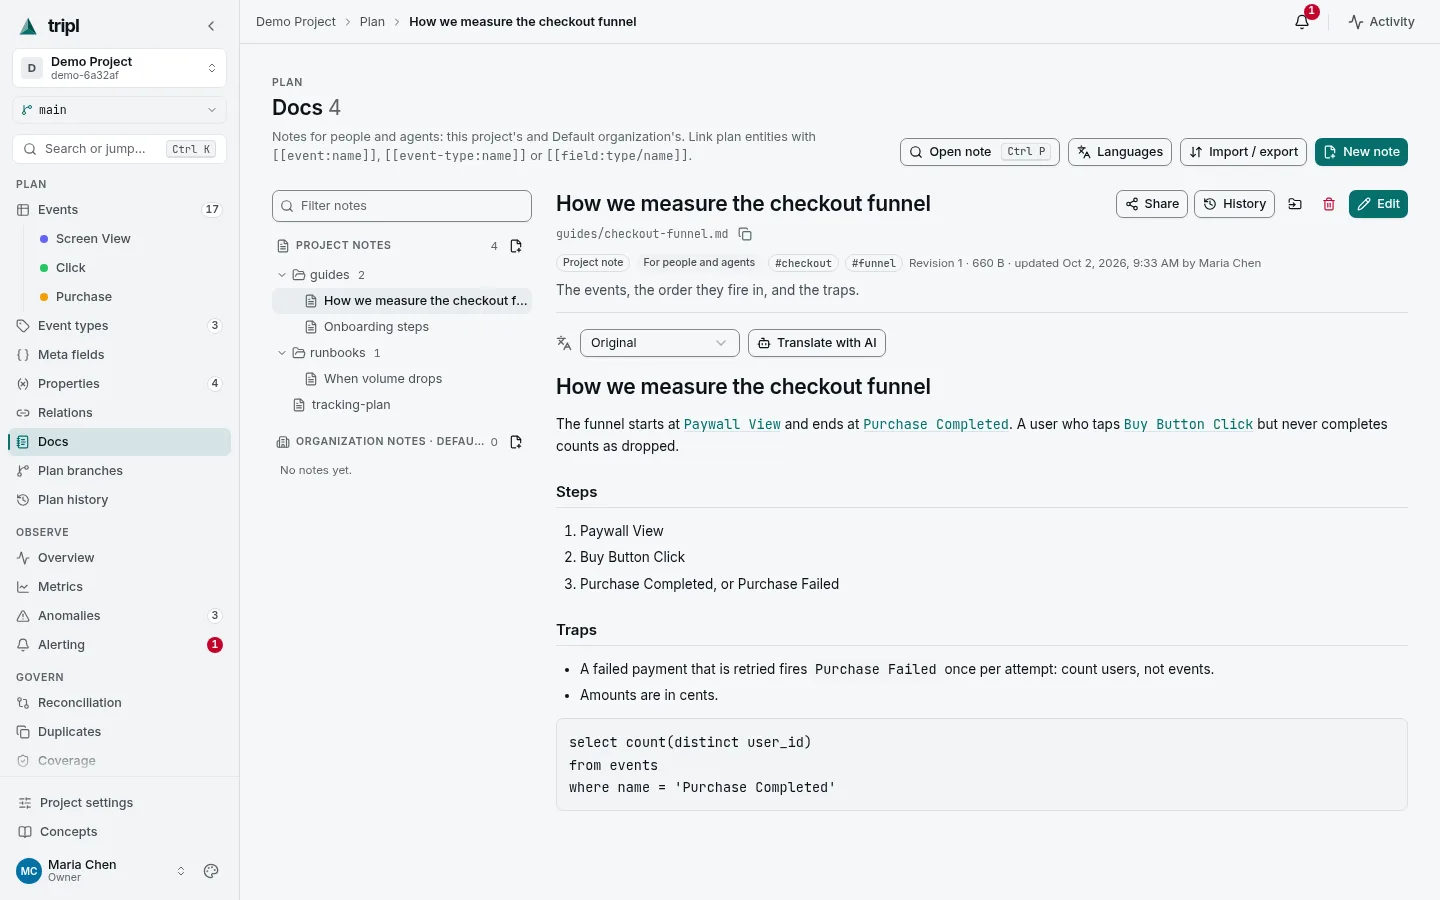
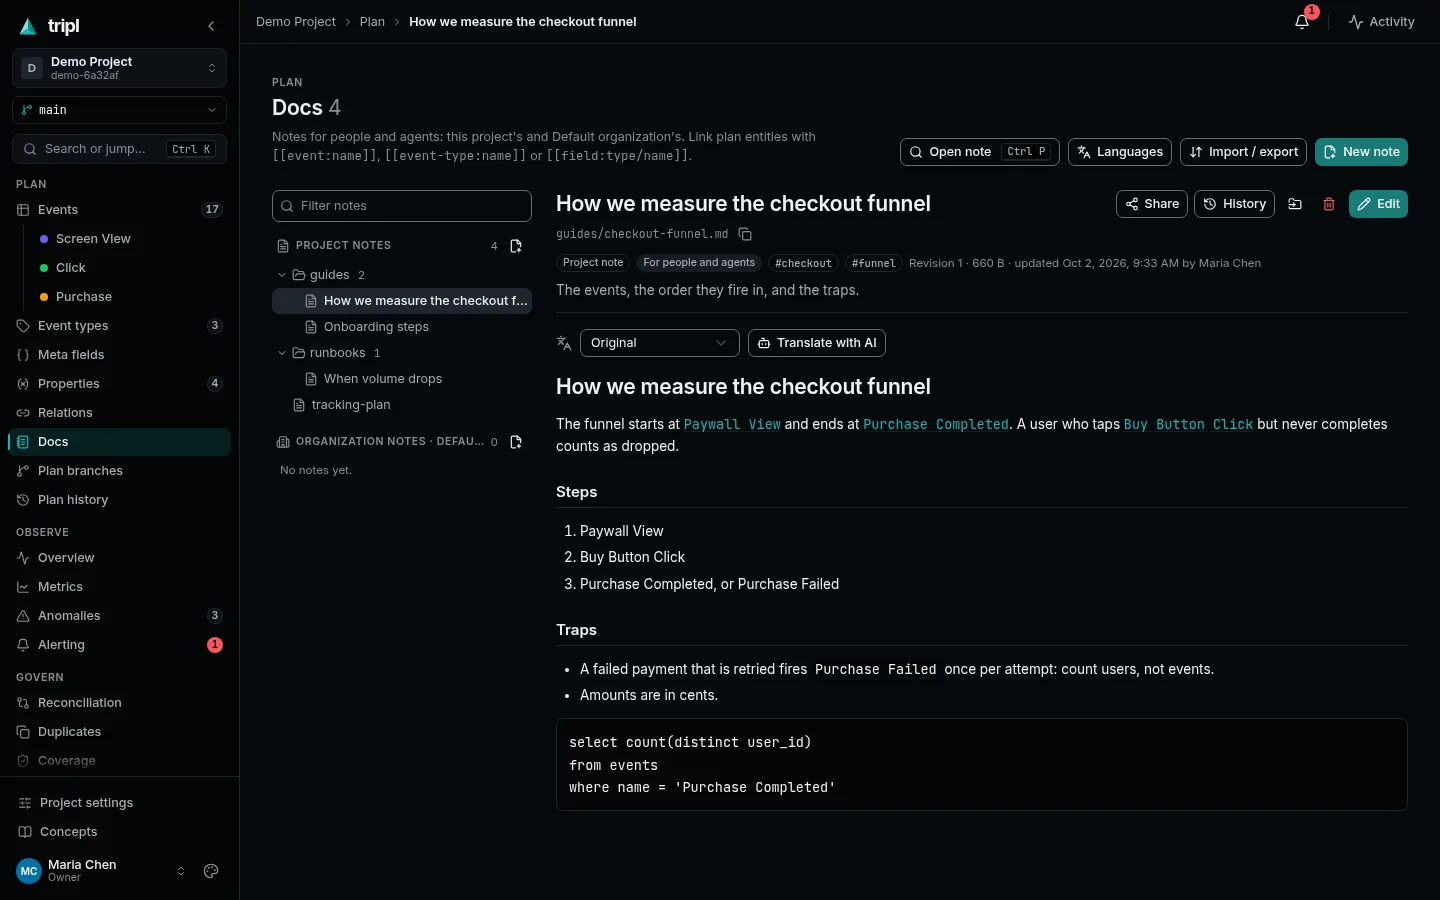
- Open Docs and choose New note. A path with a
/makes the folder too —recipes/checkout-funnel.md. Pick This project or the Organization root: organization notes show up in every project of the organization. - Write Markdown in the editor; the preview on the right renders it as you
type. Link plan entities by name with
[[event:checkout_started]],[[event-type:checkout]]or[[field:checkout/amount]](add|labelfor your own link text). A link that points at nothing on the main plan turns red and is listed above the note, so a rename never breaks a note silently. - Optional frontmatter at the top sets the title, a description, tags and the
audience (
human,agentorboth). - Save. Every save is a revision: History shows who changed what, with a diff, and Restore brings an earlier version back as a new revision.
Notes that link to an event or event type appear on its page under Notes,
with New note about this for editors. Ctrl/⌘+P on the Docs page opens
any note by title or path, and the global search (Ctrl/⌘+K) finds notes by
their text. Import / export moves a whole folder of .md files in or out as
a zip — an agent skill (SKILL.md plus references/) imports as it is.
Viewers read notes; editors write them. Notes are not branch-aware: there is one version of each, and links resolve against main. More in Docs catalog.
Observe: watch the data
With a plan in place and metrics collecting, monitoring comes to life: tripl learns the normal rhythm of every event — including time-of-day and weekday patterns — and raises a signal on an unexpected spike, drop, or change of shape. That detection is automatic and needs no setup.
- Overview — start here for the state of the whole project.
- Alert rules (Alerting › Rules) — the list of your alert rules, each attached to a scope, with the condition it watches for, where it routes, and its live state.
- Metrics — define project-wide metrics of three kinds: From tracked
events, From a fact table, or Custom SQL. A new metric starts on
From tracked events; a kind card says so when the project has no events
or no fact tables yet. The form opens on a template gallery — Start from
scratch skips it, and Browse templates brings it back. A metric can
have an Owner, shown as an avatar on its catalog row. Create one with
Create and start collecting, or Save as draft — a draft is not
collected until Activate on its page. Creating a Custom SQL metric whose
query has not previewed cleanly asks first. The top bar reads
Metrics ›
› Edit while you edit one. Fact tables keep a reusable read-only query, introspected columns, and named filters; a fact metric applies an aggregate or ratio to them. Active metrics collect on schedule and open the same monitoring drilldown as event volume. The drilldown links back to the source fact table, shows when the next collection is due, and can reveal the generated primary batch SQL without executing it — to viewers too, since it is built from configuration they can already read. Running Recompute on a fact metric refreshes the other active metrics on that fact table in the same multi-aggregate batch rather than scanning it once per metric. The catalog lists every metric, keeps its search, status, kind, review-status and stat filters in the address (so Back and shared links return to the same view), and reports a finished Collect now even if you have moved on to another page. A metric carries a reviewed mark, set with Mark reviewed. A metric page's ⋯ menu has Create alert…, which opens the rule form already scoped to that metric. Archiving, one metric or many, can be undone from the confirmation toast. - Fact tables — saving a fact table reads its columns from the SQL whenever the SQL or data source changed since the last Preview columns, and checks that the timestamp column is one of them. Named row filters are written in a SQL editor that completes the table's columns. Delete fact table in the editor, or Delete in a row's ⋯ menu on the list, removes one; while fact metrics still read it, the refusal names them.
Open an event's monitoring detail (from the event or one of its signals) to see, across tabs:
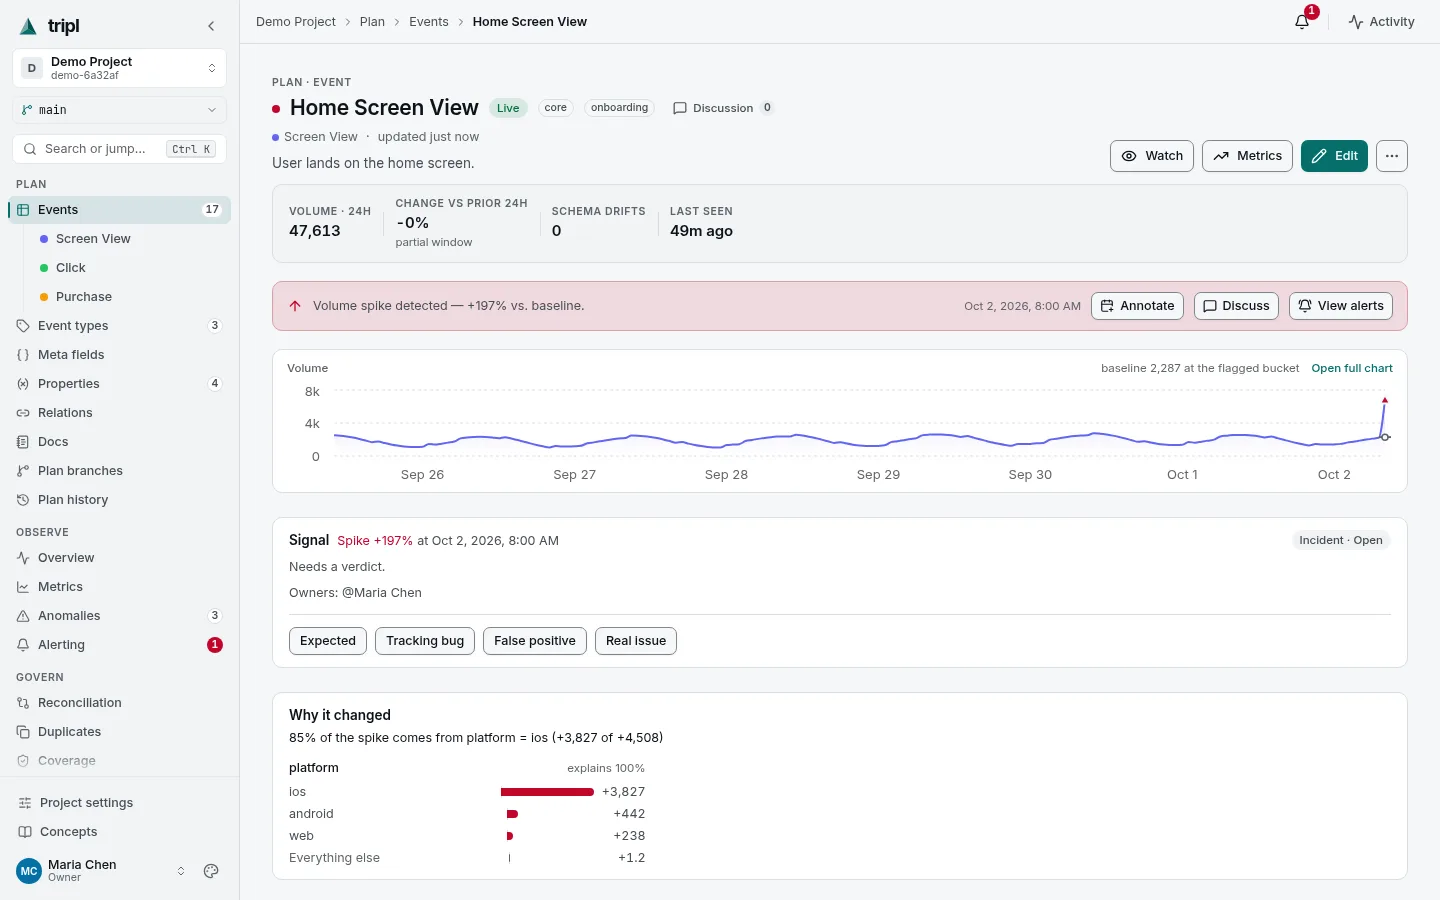
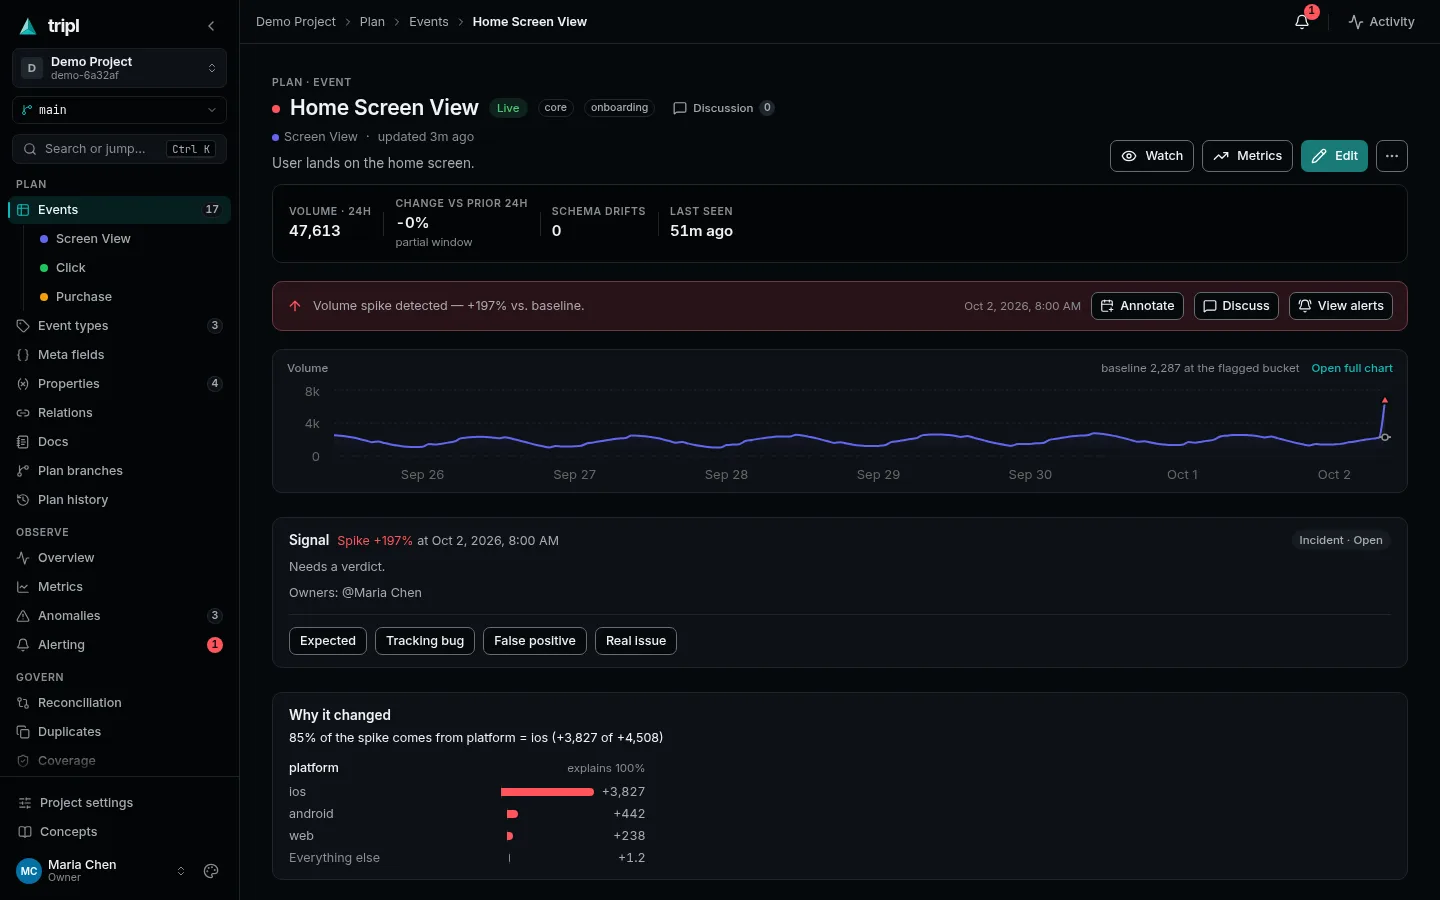
- Volume (Value for a catalog metric) — every drilldown opens on the last 7 days, at hourly granularity or the metric's collection interval if that is coarser. Granularities that would draw more than 500 points over the selected range are not offered, except the collection interval itself: a 15-minute metric can always be read at 15 minutes, with its anomaly band and forecast. When you pick a coarser granularity, event volumes and additive metrics (counts and sums) add up, while ratios, averages, percentages and distinct counts are averaged, so a conversion rate stays on its own scale. The range, granularity, tab and filters are kept in the page address, so a link or a refresh reopens the same view. The chart includes a short forecast of where the next native-interval point should land — a hollow point with a whisker for its likely range — only when the selected granularity matches that collection interval, plus a strip summarising the latest signal (Flagged bucket, Change, Actual, Expected, Deviation) and top movers showing which slice of the data moved. The chart has a legend, a partial first or last bucket of a rolled-up range is drawn dashed, and the caption under it says what one point is and how fresh the series is: Hourly · newest bucket 12m ago · collected 8m ago · next Sep 26, 3:00 PM (or next collection due now), the last two from the scan's own collection record. The signal banner offers Annotate to mark the flagged bucket, and so does the signal summary on a project-total or event-type page and on a metric's page. A metric's Delete is in the page's … menu, and the project total's page is titled Total volume. Other rollups omit the forecast because one native bucket is not a forecast for the whole aggregate bucket. You can also add annotations to mark deploys, releases, or incidents directly on the chart. Pick the day from the calendar (arrow keys move by day and week, Page Up/Down by month) and type the time beside it; it is your local time, and starts at now. Annotations draw in a neutral colour so they cannot be mistaken for anomalies, and deleting one asks first (a project-wide annotation is removed from every monitoring chart in the project). Markers you did not draw yourself — Release version when a new app version goes live, and deploy markers posted by a pipeline — show muted with a small icon; Show releases hides them and leaves your own annotations in place. See Chart annotations.
- Heatmap — activity by hour of day and day of week; a cell's detail appears on hover or tap. It needs a scan that collects hourly or finer; on a 6-hour, daily or weekly scan the tab explains that there is no hour-of-day detail instead of drawing a mostly empty grid.
- Distribution — whether a field's mix of values is drifting (reported as a PSI score and a band of normal / minor / significant).
- Breakdowns (event-level) — splits an event's volume into one series per value of a chosen column. For the scan's designated platform column, share anomalies are called out separately when one platform's ratio changes even though total volume remains stable. The tab has its own range and granularity controls. The chart draws up to eight values at once and says how many it left out; pick values below it to compare others.
- By version — appears only when the event's scan names an app-version column. It splits volume across recent releases, tracks adoption, and lists release regressions (what disappeared or dropped in the newest release versus the previous one). The regressions list covers the whole scan, not only the event you are looking at; each row links to its event. Scans without a version column simply don't show this tab.
Choose how many releases remain visible under Settings → Project → General → Version monitoring. The same value applies immediately, without recollecting data, to event charts, adoption/project totals, and catalog metric version charts. Older releases are combined into Other.
Schema drift — a new field appearing, a relied-upon field vanishing, or a field carrying new values — surfaces in the catalog alongside your events.
Several of these views read directly from collected metrics, so they stay empty until a scan has actually run and gathered counts. You'll see messages like "No metrics data available — run a scan to start collecting volume metrics" on the volume chart, a similar prompt on the heatmap, and "No breakdown groups yet" on Breakdowns. None of these mean anything is broken — they mean metrics haven't landed for that scope yet. Connect a source, run a scan, and give it time to collect before judging what detection shows.
To use Breakdowns, edit the event and add a column under Metric breakdowns, then run a scan; its volume will then split into a series per value of that column.
If the defaults are too sensitive or too quiet for a given event, tune what counts as "abnormal" in the project's Detection settings.
Alerting: get the right person notified
A signal only helps if someone hears about it. Open Observe → Alerting. It is split into four tabs: Inbox (incidents to triage, and where an alert link lands you), Rules (every alert rule with its live firing state — replay, mute, edit and delete sit behind each row's … menu), Destinations (the channels rules route to), and Delivery log (every delivery, for checking whether a message physically went out). A project with nothing configured yet skips the tabs and shows a guided setup instead, which also asks which scan the first rule should watch.
1. Add a destination
Create at least one place alerts can go. tripl supports:
- Slack (incoming webhook URL)
- Telegram (bot token + chat ID)
- Webhook (a generic endpoint that receives a JSON payload, with an optional secret header for auth)
- Email (one or more recipient addresses; SMTP host and credentials come from the instance config)
- Jira (opens a new issue per delivery)
- Linear (opens a new issue per delivery)
Mark the destination enabled when you save it.
A demo project cannot send anywhere: it only accepts its own local demo sink, and adding any of the destinations above is refused. Rules, replay, deliveries, and the Inbox are still fully explorable there — the sends are simulated and recorded locally. See The demo workspace.
2. Create a rule
A rule decides which signals are worth interrupting someone for and routes them to a destination. The editor walks four steps: What to watch (the scopes), When (spikes, drops or both, how big a change has to be — a new rule starts at 30% — and a cooldown, entered as an amount and a unit, so the same problem doesn't notify you repeatedly), Where (the destination), and Customize message, collapsed until you want to change the template. Less common settings are under Advanced. Saving confirms with a toast. Schema drift, distribution drift, property value drift, and release regressions are separate opt-in toggles; they stay off until the rule explicitly subscribes to them.
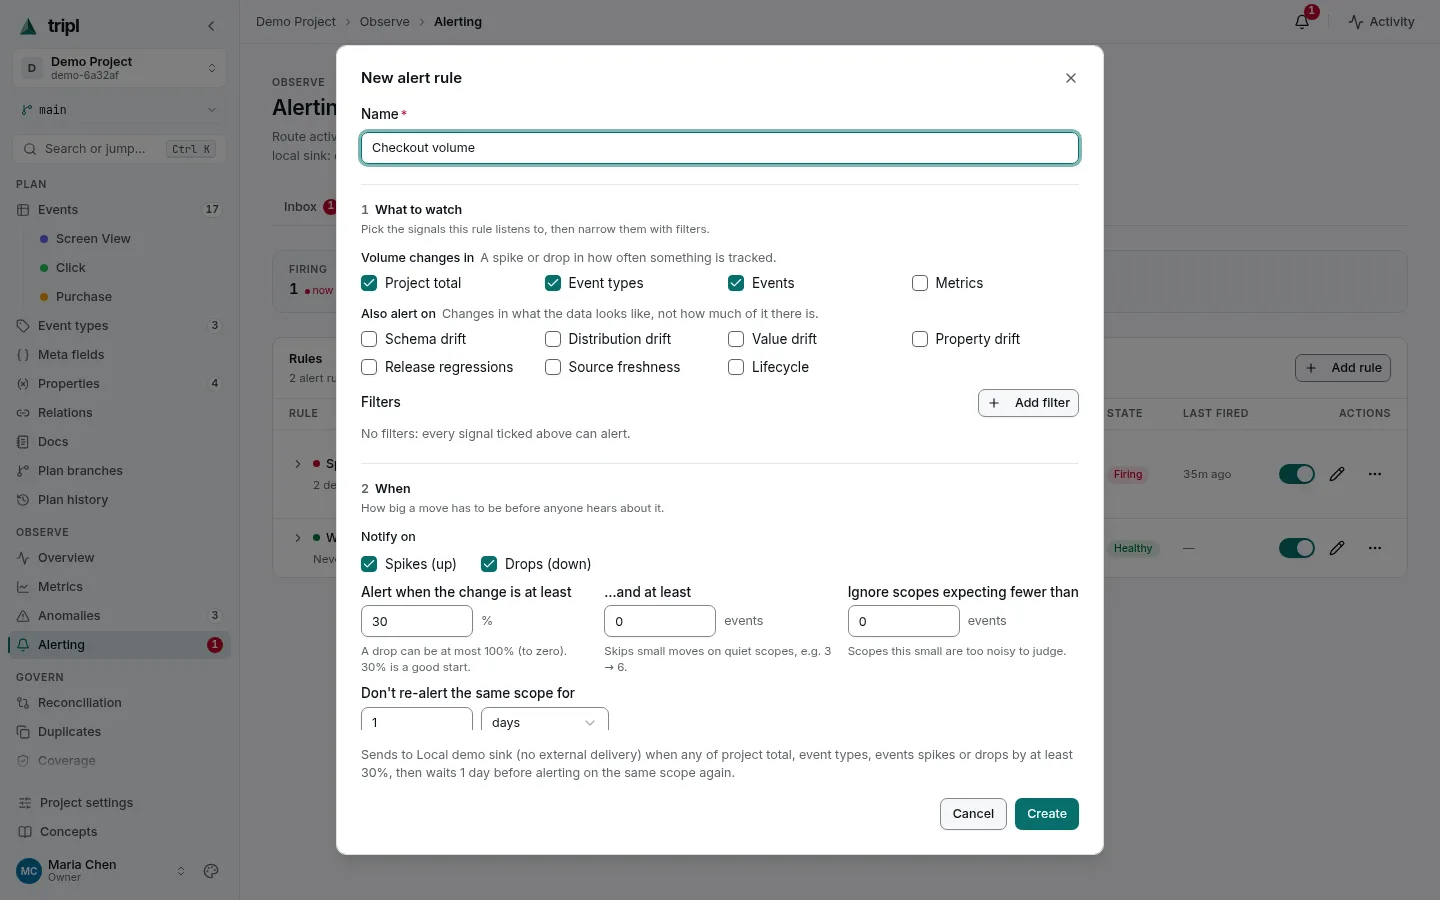
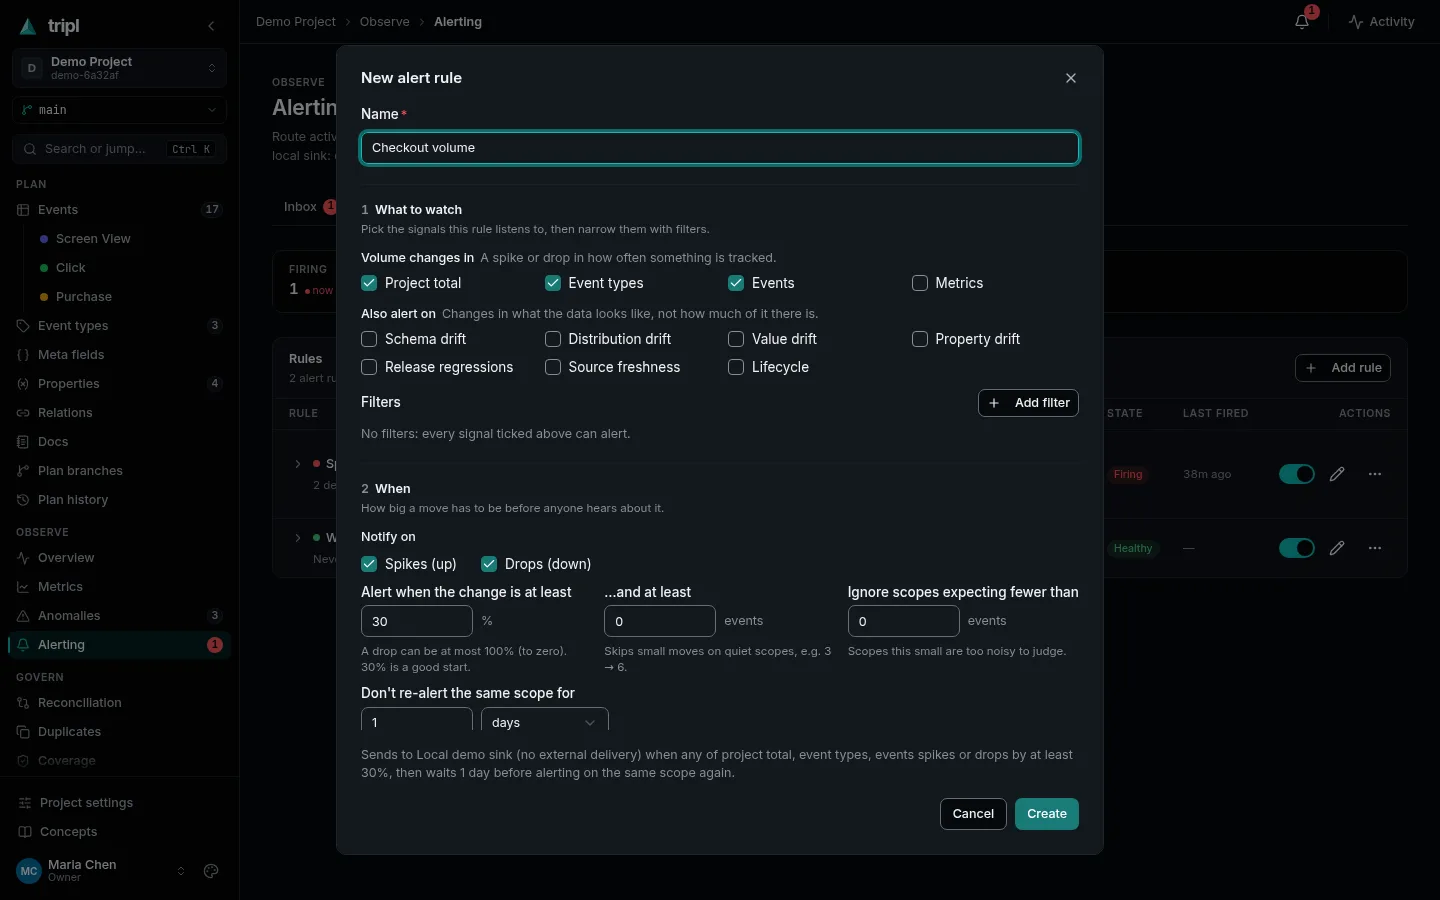
Use the rule's Replay (in its … menu; it runs as soon as it opens) to run recent days of real data against it and see exactly what it would have sent — you can even override the cooldown to compare. Tune it until it's signal rather than noise before turning it on.
3. Track what was sent
- Deliveries records every alert that went out — its full content and whether it succeeded — with filters by status, channel, destination, rule, and scan.
- The Inbox is one row per incident, with six actions: acknowledge, resolve, mute (1h / 24h / 7d / indefinitely), reopen, false positive, and a note on its own. The first four of those stop further alerts for that incident — but only a mute lasts beyond the incident, and only a false positive tells the detector anything. See Silencing an incident.
- After a bad deploy you rarely want to press those buttons twenty times: tick the incidents' checkboxes and the N selected bar acknowledges, resolves, reopens, notes or mutes all of them at once. It is the same decision applied N times, with one exception — false positive stays per incident, because it permanently retunes the scope it fired on. See Acting on several incidents at once.
If you expected an alert and the Deliveries list says "No deliveries yet" or the Inbox says "No correlated alert groups", work through this checklist:
- Is there data to alert on? Alerts come from monitoring signals, which come from collected metrics. If a scan hasn't run, there are no signals to send.
- Is the rule enabled, and the destination enabled? Both must be on.
- Does the rule actually match? Check its scope, direction, and minimum change size — a real anomaly that's smaller than your threshold won't send.
- Is the cooldown swallowing it? A recent delivery for the same problem can suppress the next one until the cooldown elapses.
- Did delivery fail? Set the Deliveries status filter to Failed to see transport errors (a bad Slack URL, an SMTP problem, etc.). A failure from a transient network error — unreachable host, refused connection, a timeout — retries itself a few times over the following minutes; any other failure, every Jira or Linear delivery, and a delivery whose destination was disabled at the time, waits for the row's Retry button.
- Did you silence it yourself? An incident you acknowledged, resolved, muted or marked a false positive stops delivering — and acknowledged counts, which is the one people do not expect. Handled incidents sort below open ones, so use the Inbox's status filter to find it rather than scrolling.
Replaying the rule against recent data is the quickest way to confirm whether it would match before you wait for the next real anomaly.
Govern: keep plan and reality honest
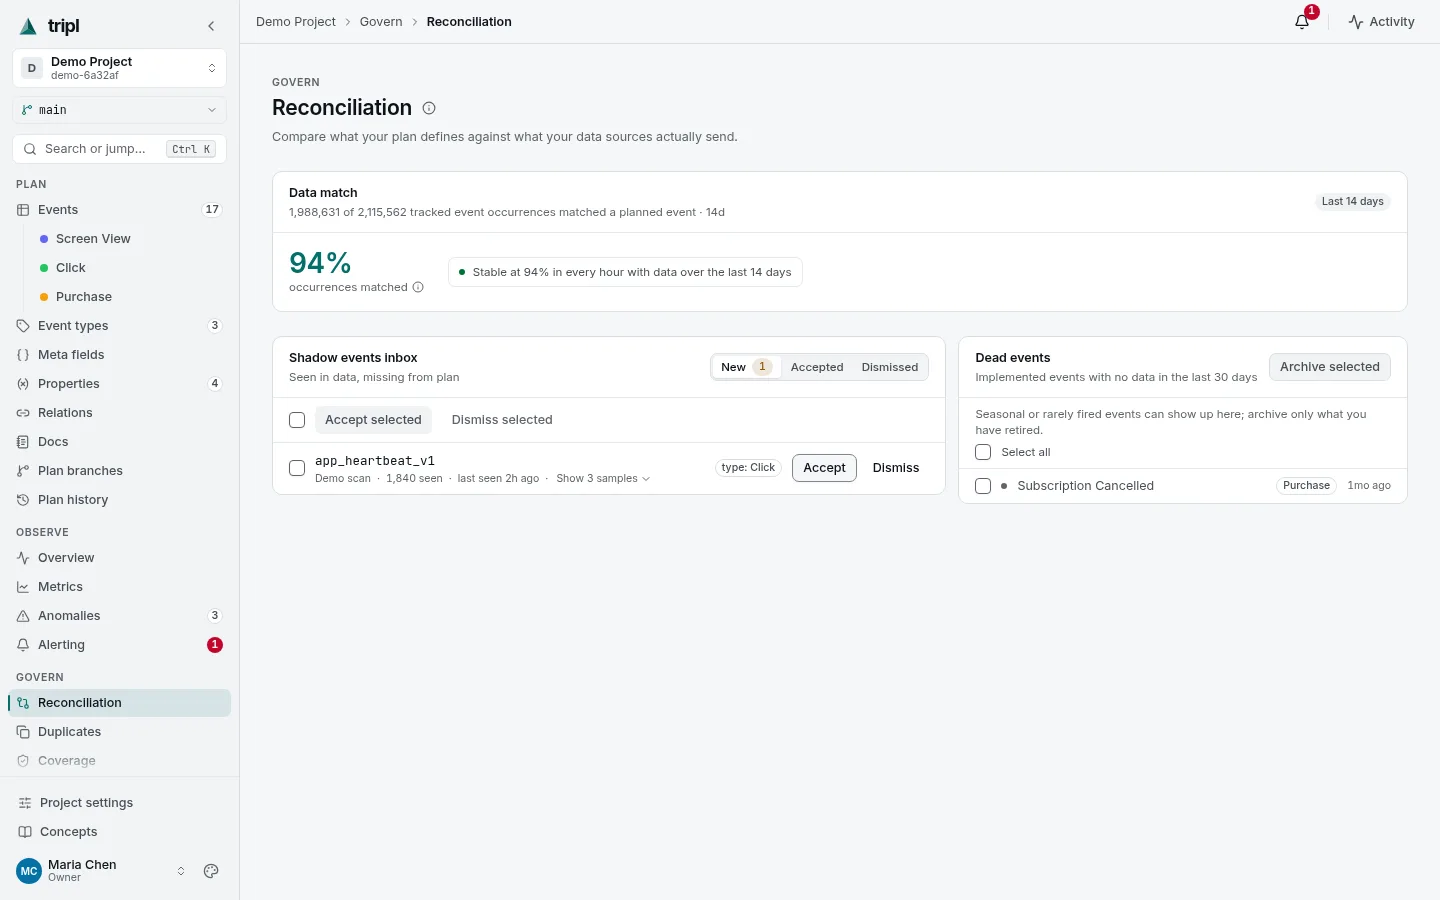
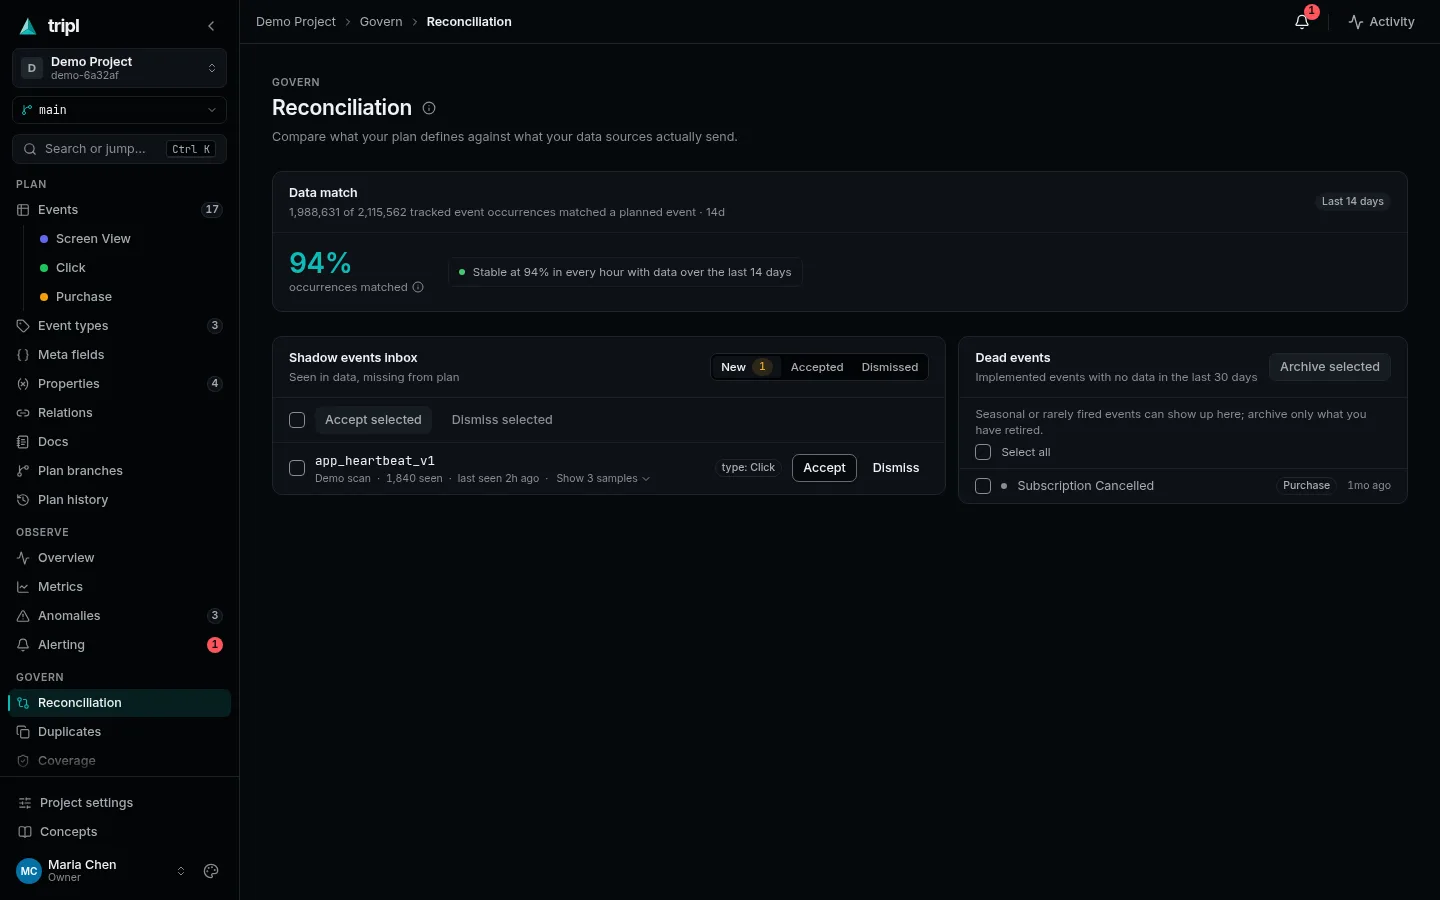
- Reconciliation — run this regularly. It's your gap checklist: documented-but-dead events to retire, and live-but-undocumented events to add to the plan.
- Audit log — every meaningful change, filterable by who, what, and when, and paged with Newer / Older so the list is not limited to the most recent entries. Each entry also names the branch it was written in, so two contradictory edits to the same object on two branches are told apart rather than reading as one person changing their mind. Entries with no branch chip were written on main, or are actions that have no branch to name at all (alerting, scans, data sources, users, API keys). This is also your first stop when recovering from a mistaken change.
- Roles — in workspace settings, invite teammates into the organization as a member, an admin or an owner. Owners and admins hold every project and manage people, data sources and scan SQL; an admin cannot make or remove owners. A member sees only the projects they are added to, as an editor (can change the plan, and alerts) or a viewer (read-only) of each — set per project under Settings → Project → Access. Instance-wide operator settings (security, observability) belong to the platform admin, which on a self-hosted instance is whoever registered first.
- API keys — issue keys for scripts and AI agents, scoped to read or write, optionally locked to a single project and given an expiry. Revoke them at any time. See the Agent API guide for details.
A realistic first week
If you're rolling tripl out on real data, this order tends to work well:
- Day 1 — connect your warehouse and run a scan to draft the plan.
- Days 2–3 — clean up the draft: descriptions, types, sensitive-data flags, value lists. Invite your team.
- Day 4 — let metrics collect, then review the first signals and tune detection sensitivity on the events you care about most.
- Day 5 — add alert destinations and a couple of rules, replay them, and turn them on.
- Ongoing — make plan changes on branches with review, and run reconciliation regularly to keep plan and reality in step.
Quick troubleshooting reference
| Symptom | Most likely cause | What to do |
|---|---|---|
| Charts say "no metrics data" | No scan has collected counts yet | Connect a source, run a scan, wait for collection |
| Data source card is amber | Last successful test is stale | Click Re-test connection |
| Data source card is red | Connection failed | Fix credentials, Edit then Re-test |
| "By version" tab missing | Scan has no app-version column | Set the version column on the scan (optional) |
| A deleted scan property comes back | Its source binding is still present | Use Exclude from scans; restore it later if needed |
| A scan-created property disappeared | A catalog run retired it — nothing in the plan referenced it. A scheduled collection does this too (a property minted from a scalar column only when the scan sets Limits → Lookback (hours)), so it can happen without anyone starting a scan | Expected cleanup; edit, document, or exclude a property you want kept |
| A property value keeps showing as drift | It is outside the effective documented list | Accept it globally or for that event, or resolve/snooze the drift |
| Alert never arrived | No signal, rule off, threshold/cooldown, or delivery failed | Work the "alert never fired" checklist above |
| Wrong change merged | — | Use the Audit log + a corrective branch through review |
| Event deleted by mistake | Deletion is permanent | Check the Audit log for who deleted it and when (an event_type.delete row, if the whole type went with it); re-create the definition by hand — earlier metrics/history are not restored |
For a wider list of issues, see Troubleshooting.
Where to go next
- Don't recognise a term used here? → Concepts
- Keeping team notes and agent skills next to the plan? → Docs catalog
- Automating tripl from a script or agent? → Agent API guide
- Working on tripl itself? → Architecture and CONTRIBUTING.md