Investigate a signal
You will: go from "this number moved" to "this is why", and leave the answer where the next person will find it.
You need: to be able to see the project. Recording a verdict needs an editor.
A signal is tripl saying an event, an event type, a metric or the project total moved further than its own history says is normal. It learns each one's rhythm, quiet nights and slow Sundays included, so a signal means unusual for this event, not merely lower than yesterday.
1. Find the open signals
Signals show up in several places: a red dot beside an event in the catalog, the Active signals panel on Overview, an alert in Slack, and all of them together on Observe → Anomalies.
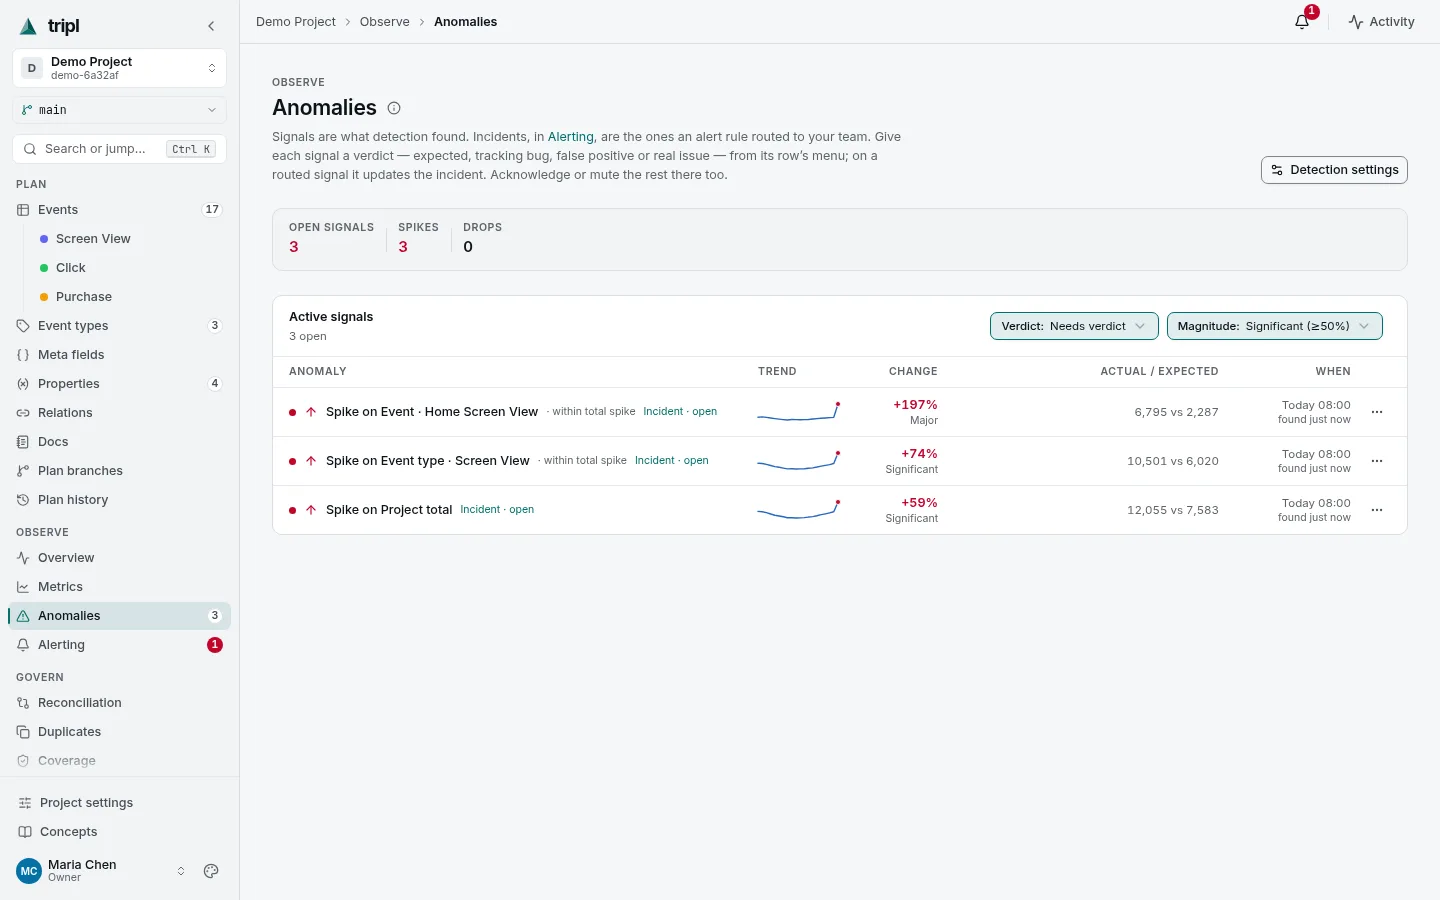
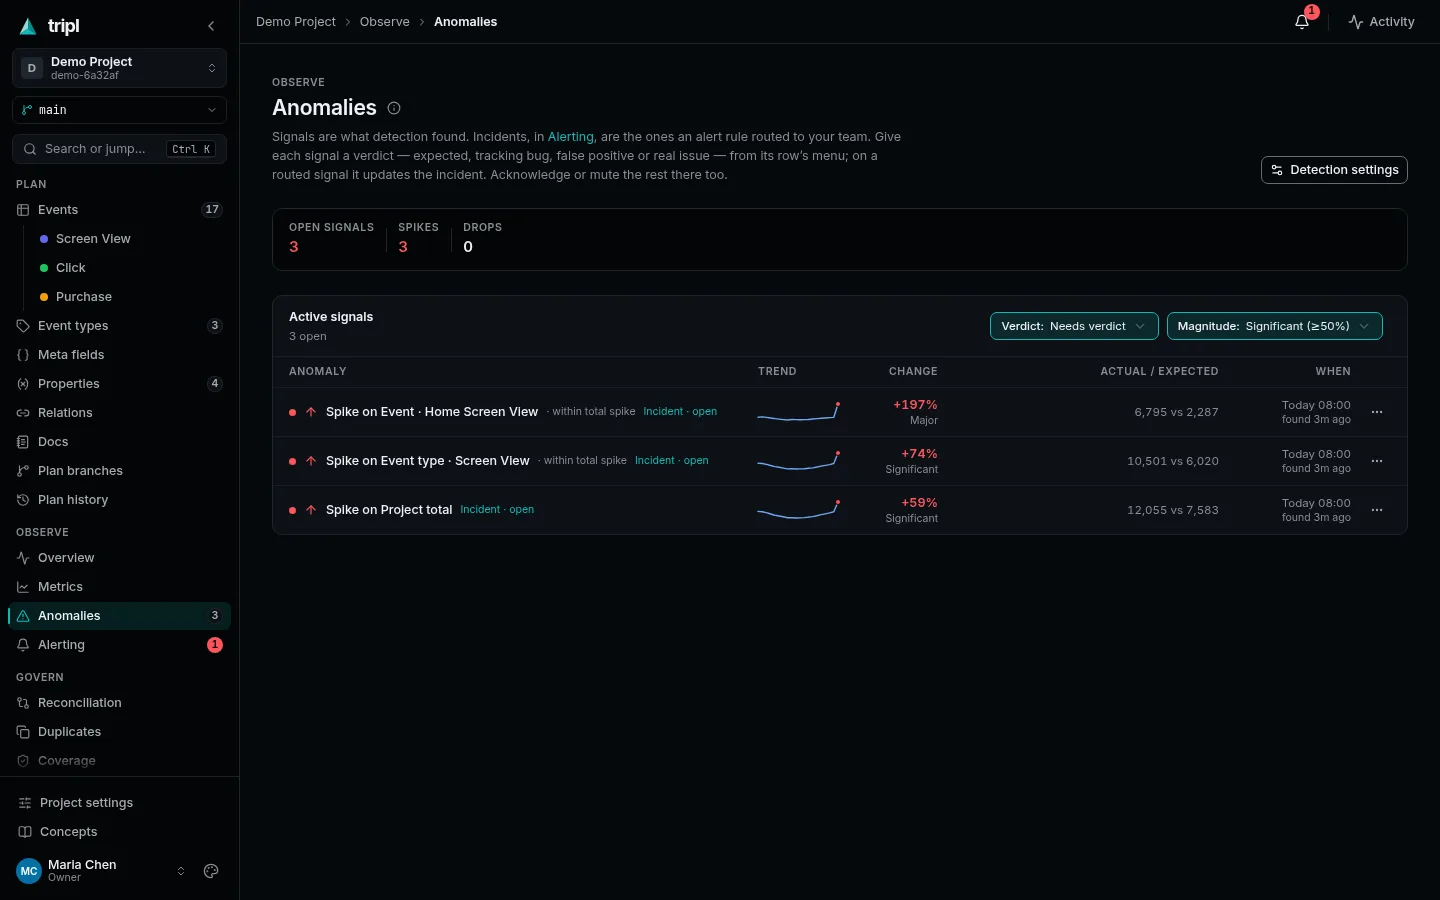
Each row says what moved, by how much, and what was expected. A small move on a large total and a large move on a single event are different stories, so start with the most specific scope: the event rather than its event type.
2. Read the event's page
Open the signal. The event's page shows the volume chart with the flagged point, the signal itself, and Why it changed: which slice of the data the move came from.
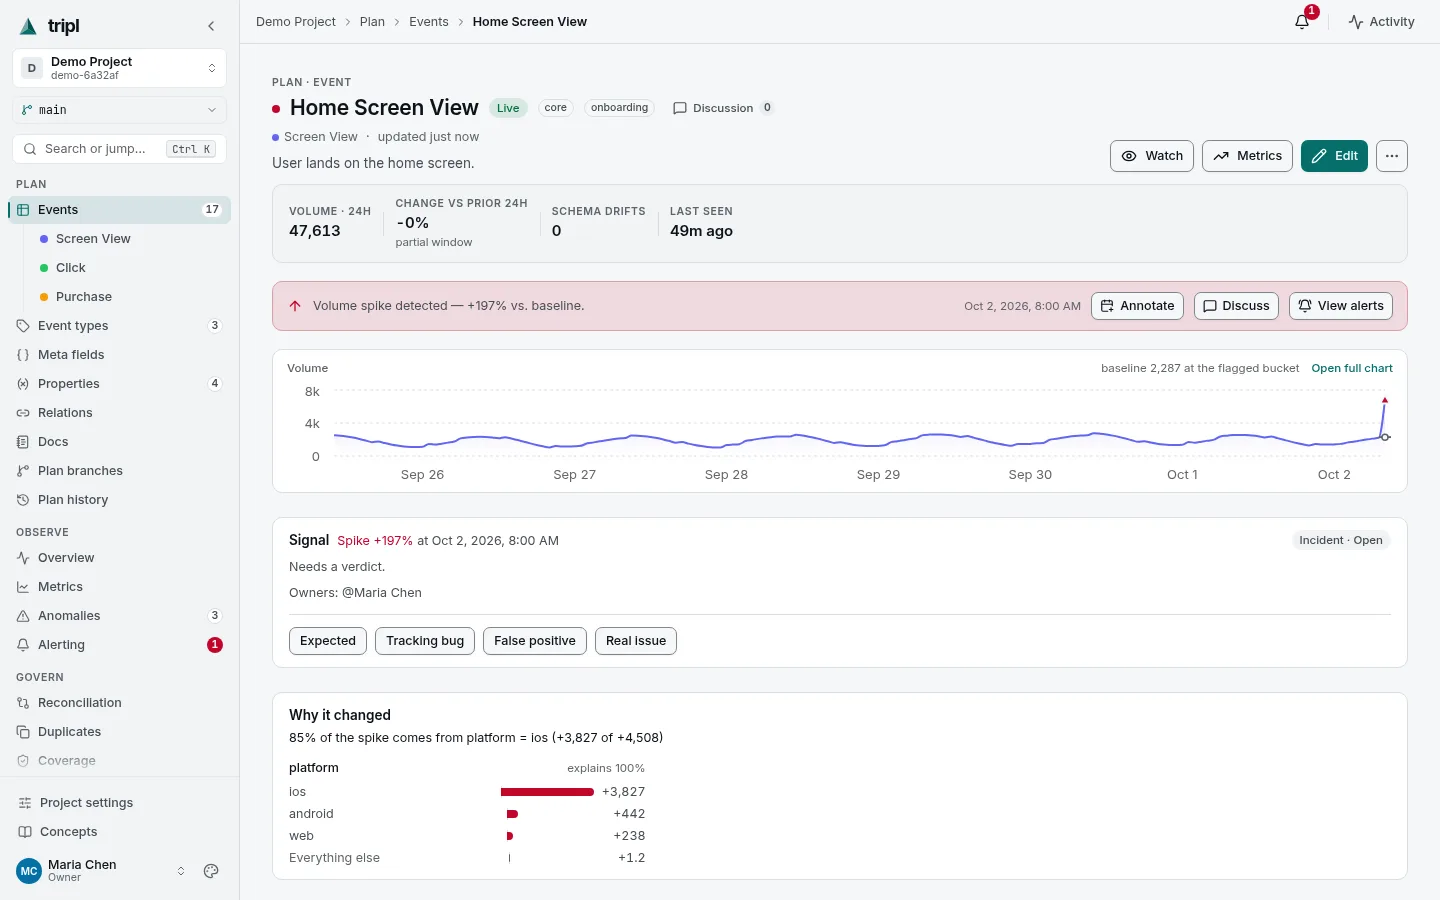
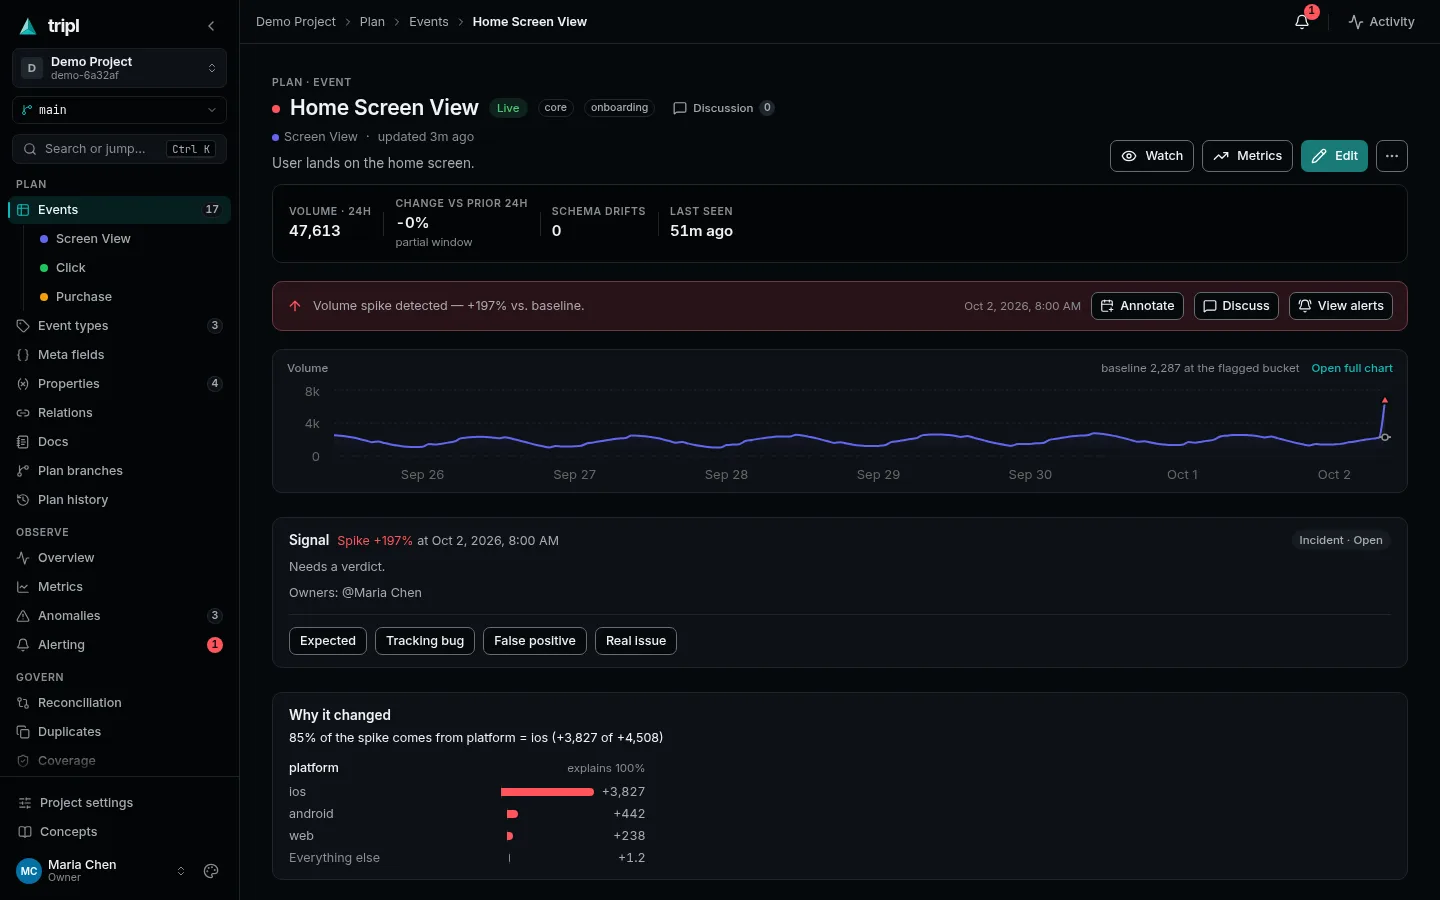
In this example, 85% of the spike comes from iOS. That is the question to take to the iOS team: a release, a campaign, or a client firing the event twice?
Further down the page, tabs show the same series in more ways: Volume with its forecast, a Heatmap by hour and weekday, Breakdowns by any column the event carries, and By version when the scan knows the app version, which shows the release the change arrived with.
3. Record what it was
Pick the verdict that fits:
| Verdict | When | What else it does |
|---|---|---|
| Expected | A known cause: a campaign, a release, the season. | Adds a note on the chart at that point. |
| Tracking bug | The data is wrong, not the product. | Offers to open a comment on the event, for the people who own it. |
| False positive | The detector was wrong about this one. | Makes detection a little less sensitive on this scope. |
| Real issue | The move is real and needs work. | Records it. |
Add a short note: "iOS 4.2 sends Home Screen View on every tab switch". The verdict stays with the signal, so nobody has to rediscover it.
If an alert rule routed the signal to an incident, handle it in Alerting → Inbox instead (see Get alerted): the incident is where its state lives.
Annotate on the event's page puts a marker on the chart, such as "Pricing page redesign". Next time the line moves at that point, everyone can see why.
More detail: How anomaly detection works explains baselines, sensitivity and Why it changed, and how to tune detection when it is too noisy or too quiet.